Economic analysis is concerned with the production, distribution, and consumption of goods and services. This section provides a summary of economic information, including trends and current conditions. It also identifies and describes major economic sectors in the Planning Area that can be affected by BLM management actions.
Economic Activity and Output
This section provides detailed information about the industries that have the greatest potential to be directly affected by BLM policies and programs in the Planning Area. These industries include mining (including oil and gas); travel, tourism and recreation; and livestock grazing. The sections below on personal income, employment, and tax revenues provide information and data about jobs, earnings, and tax revenues contributed by these economic sectors, as well as other economic sectors, such as construction and manufacturing, that may be indirectly affected by BLM actions.
Economic Activity: Mining, Including Oil and Gas
Table 3-61 provides a summary of the quantity and value of mining production in the counties in the Planning Area, and for the state as a whole. Economically, the largest contributors to mining activity in all four counties are oil and gas; bentonite is also important in Big Horn County. Of the Planning Area counties, Park County has the greatest value of mineral production. Park County produces a bit more than 10 percent of the state’s oil, while Big Horn County produces over half the bentonite in the state. Section 3.2 Mineral Resources contains additional information about mineral resources in the Planning Area.
Table 3.61. Mineral Production and Value by County in the Planning Area
| Mineral | Big Horn County | Hot Springs County | Park County | Washakie County | state of Wyoming |
| Production or Sales (units) | |||||
| Oil (barrels sold) | 2,002,740 | 2,837,978 | 7,543,115 | 389,930 | 51,628,233 |
| Gas (mcf sold) | 2,627,140 | 295,782 | 11,785,563 | 2,382,003 | 2,257,751,824 |
| Coal (tons) | 0 | 167 | 0 | 0 | 466,224,349 |
| Gypsum (tons) | 208,400 | 0 | 87,860 | 0 | 315,666 |
| Sand and Gravel (tons) | 46,104 | 25,682 | 535,519 | 69,393 | 17,026,513 |
| Bentonite (tons) | 2,471,139 | 8,684 | 0 | 234,528 | 4,199,457 |
| Taxable Valuation ($ millions) | |||||
| Oil | $157 | $216 | $567 | $29 | $4,089 |
| Gas | $14 | $2 | $75 | $13 | $12,003 |
| Coal | $0 | $0.01 | $0 | $0 | $3,761 |
| Gypsum | $0.7 | $0 | $1.0 | $0 | $2.0 |
| Sand and Gravel | $0.1 | $0.03 | $0.7 | $0.1 | $30.9 |
| Bentonite | $37 | $0.1 | $0 | $1.8 | $58 |
| Source: Wyoming DOR 2010. Data are for production year 2008. mcf thousand cubic feet | |||||
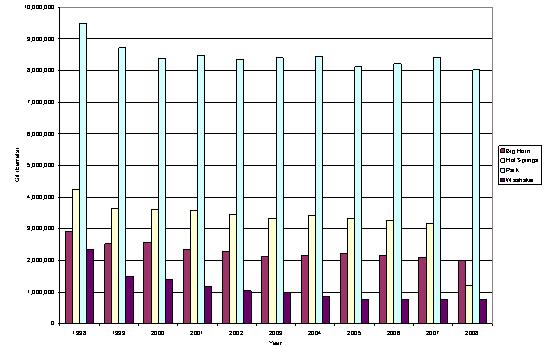
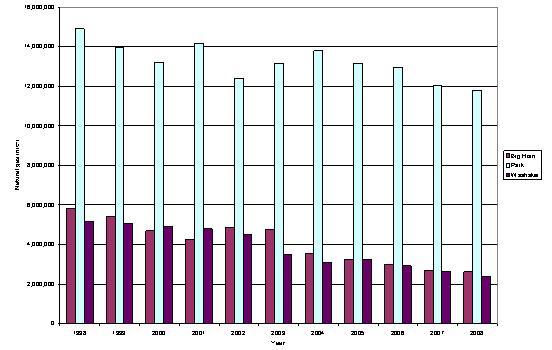
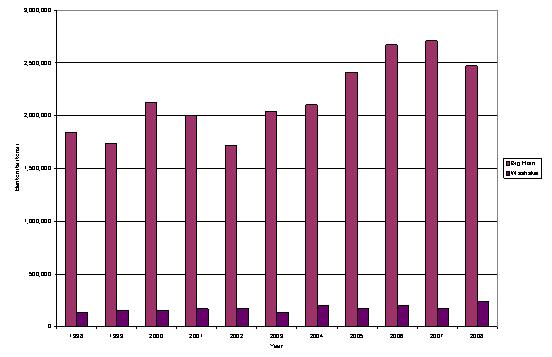
A trend analysis of production data suggests that oil and gas production is generally decreasing, while bentonite production generally increased from 2002 to 2007 and decreased again in 2008. Figures 3-19, 3-20, and 3-21 provide production trends for 1998-2008 for each of these.
Sources: Wyoming DOR 2009; Wyoming DOR 1999; Wyoming DOR 2000; Wyoming DOR 2001; Wyoming DOR 2002;Wyoming DOR 2003; Wyoming DOR 2004; Wyoming DOR 2005; Wyoming DOR 2006; Wyoming DOR 2007; Wyoming DOR 2008; Wyoming DOR 2010
Sources: Wyoming DOR 2009; Wyoming DOR 1999; Wyoming DOR 2000; Wyoming DOR 2001; Wyoming DOR 2002; Wyoming DOR 2003; Wyoming DOR 2004; Wyoming DOR 2005; Wyoming DOR 2006; Wyoming DOR 2007; Wyoming DOR 2008; Wyoming DOR 2010.
Note: Hot Springs County is not shown due to very low production.
Sources: Wyoming DOR 2009; Wyoming DOR 1999; Wyoming DOR 2000; Wyoming DOR 2001; Wyoming DOR 2002; Wyoming DOR 2003; Wyoming DOR 2004; Wyoming DOR 2005; Wyoming DOR 2006; Wyoming DOR 2007; Wyoming DOR 2008; Wyoming DOR 2010.
Note: Only Big Horn and Washakie Counties are shown; production is zero in Park County and very low in Hot Springs County.
Because the BLM manages subsurface mineral resources in excess of the surface lands it administers, its decisions can have a potentially large effect on mining in the Planning Area (see Section 3.2 Mineral Resources for more detail). From an economic perspective, mining is a key contributor to the economic well-being of the Planning Area, and therefore BLM’s management decisions in this area could have a potentially large effect on economic conditions.
Economic Activity: Recreation
Federal lands within the Planning Area provide a broad spectrum of outdoor opportunities for Planning Area residents and visitors. Recreation on public lands also provides economic benefits. Recreation service providers (hotels, outfitters, equipment manufacturers and dealers, restaurants) depend on public lands, in part, for their livelihood.
Recreation visits are commonly measured in recreation visitor-days (RVDs). The WGFD estimates that the WFO received 123,600 RVDs in 2007 for hunting and fishing on BLM-administered lands, and the CYFO received 60,034, for a total of 183,634 for the Planning Area. This represents about 18 percent of the hunting and fishing RVDs on BLM-administered land in Wyoming, and five percent of the hunting and fishing RVDs in Wyoming as a whole. Other popular recreation activities include camping and picnicking, driving for pleasure, nonmotorized travel, and motorized vehicle use (BLM 2009b). These recreational opportunities on BLM-administered lands contribute to economic values in the Planning Area in terms of both providing income from outsiders (visitors from outside the region who spend time and money in the region) and local residents.
Figure 3-22 shows travel and tourism spending in the Planning Area. In real terms, travel and tourism spending was steady from 2001 to 2008 in all four counties in the Planning Area. Spending was much higher in Park County than the other three counties, presumably due to its proximity to Yellowstone National Park. The figure does not distinguish travel for business from travel for pleasure; however, a recent study by the Wyoming Office of Travel and Tourism indicates that statewide, in recent years, the great majority of trips (e.g., 98 percent, in 2006) are due to tourism for pleasure (Wyoming State Office of Travel and Tourism 2007).
Source: DRA 2007; DRA 2008; DRA 2010; adjusted for inflation using Wyoming Economic Analysis Division 2010
Economic Activity: Livestock Grazing
The BLM is responsible for administering livestock grazing on public lands across the Planning Area. The kinds of livestock grazing on public lands consist primarily of cattle, but also include sheep, domestic horses, and small numbers of bison. In addition, goats and sheep are sometimes authorized for the purpose of suppressing weeds. The BLM administers 687 grazing allotments covering 3.2 million acres in the Planning Area. The majority of the allotments in the Planning Area operate under grazing strategies incorporating rest, seasonal rotations, deferment, and prescribed use levels that provide for adequate plant recovery time to enhance rangeland health (BLM 2009b).
According to data from the Rangeland Administration System, there are 78,324 active AUMs in the Cody Field Office Planning Area and 226,522 active AUMs in the Worland Field Office Planning Area, for a total of 304,846 active AUMs. Whereas active AUMs represent the maximum amount of forage generally available in any given year under a permit or lease, authorized AUMs represent the total forage the BLM will allow the permittee to use in a given year. The BLM adjusts authorized use on an annual basis to account for the actual forage value of the land in a given year, based on climatic conditions (e.g., drought), as well as taking into account the needs of the land and the ranch operators. The number of authorized AUMs varies every year; from 1988 through 2009, the lowest number was 131,346 and the highest was 241,333. The average for these years was 195,742 AUMs, which is about 64 percent of the active AUMs (US Census Bureau 2010a).
BLM-administered grazing fees are established by the Public Rangelands Improvement Act of 1978. These fees are lower on average than state or private lands because of the formula established by Congress. Federal grazing fees in Wyoming were $1.56 per AUM in 2006, and $1.35 per AUM in 2007, 2008, and 2009 (BLM and USFS 2007; BLM and USFS 2009; BLM and USFS 2010). For comparison, grazing fees on state land were $4.78 per AUM in 2006, $5.17 per AUM in 2007, $5.21 in 2008, and $5.13 in 2009 (Pannell 2008; Wyoming SBLC 2009). The average grazing rate on privately owned nonirrigated land in Wyoming was $15.10 per AUM in 2006, $15.40 in 2007, $15.70 in 2008, and $16.00 in 2009 (Shepler 2008; NASS 2009; NASS 2010).
Taylor et al. (Taylor et al. 2004) analyzed the importance of BLM-administered land for livestock grazing in nearby Fremont County using a simulated enterprise level ranch budget. They pointed out that most ranches are typically only partially dependent on federal land grazing for forage, but this forage source is a critical part of their livestock operation because of the seasonal dependency, even when the proportion of acres of AUMs contributed by federal land grazing is relatively small for the operation. Much of a ranch’s private land is used as hay ground to produce hay for winter feeding. Using hay acreage to feed cattle during the summer means a ranch has to purchase hay for the winter. The rigidity of seasonal forage availability means that the optimal use of other forages and resources are impacted when federal AUMs are not available (Taylor et al. 2004). These authors, as well as many others in studies they reviewed from 1975 through 2002, found that potential reductions in income and net ranch returns are greater than the direct economic loss from reductions in federal grazing.
The USDA conducts a comprehensive national survey of agricultural operations every five years, the Census of Agriculture, which provides a rich source of data on agricultural operations down to the county level. The USDA maintains on an ongoing basis a list of agricultural operators who receive the Census of Agriculture survey in the mail, and follows up with various forms of outreach to ensure a high response rate. The response rate for the 2007 survey was 85.2 percent. The USDA also adjusts the data to account for non-response, using well-established statistical methods (USDA 2009).
In 2007, there were 1,797 agricultural operations in the Planning Area counties according to the Census of Agriculture, which defines an agricultural operation (or “farm”) as a place from which $1,000 worth of agricultural products is sold within a year (USDA 2009). Together, these farms and ranches encompassed about 2.3 million acres. The combined gross revenue of these operations, including agricultural products sold, government support payments, and other farm-related income, was $200 million. (This figure does not include income generated by employment or business activities which are separate from the farm business.) The net income aggregated across the 1,797 operations in the four Planning Area counties, according to the Census of Agriculture, was about $37.5 million.
Table 3–62 provides these data for individual counties in 2007, as well as data from the two most recent prior Census of Agriculture surveys (2002 and 1997). The table also provides state-level data for comparison.
Table 3.62. Number of Farms, Land in Farms, Revenue, and Income, 1997-2007
| Variable/Year | Big Horn County | Hot Springs County | Park County | Washakie County | state of Wyoming |
|---|---|---|---|---|---|
| Number of farms, 2007 | 621 | 180 | 782 | 214 | 11,069 |
| Number of farms, 2002 | 501 | 147 | 711 | 184 | 9,422 |
| Number of farms, 1997 | 495 | 147 | 588 | 205 | 9,232 |
| Land in farms, 2007 (acres) | 438,033 | 547,084 | 881,736 | 469,804 | 30,169,526 |
| Land in farms, 2002 (acres) | 411,782 | 876,560 | 810,302 | 426,500 | 34,402,726 |
| Land in farms, 1997 (acres) | 443,434 | 944,205 | 1,011,425 | 450,036 | 34,088,692 |
| Total farm revenue, 2007 | $57.2 | $15.0 | $85.9 | $41.9 | $1,245.8 |
| Total farm revenue, 2002 | $41.4 | $8.9 | $55.8 | $26.8 | $933.6 |
| Total farm revenue, 1997 | $45.0 | $9.7 | $67.9 | $29.3 | $932.6 |
| Net farm income, 2007 | $8.3 | $4.5 | $11.3 | $13.3 | $275.7 |
| Net farm income, 2002 | $4.4 | $0.8 | $9.0 | $5.2 | $115.3 |
| Net farm income, 1997 | $13.3 | $2.1 | $18.7 | $8.6 | $242.2 |
| Sources: USDA 2009; USDA 2004; USDA 1999Note: Farm revenue and net farm income are in millions of current-year dollars (that is, not adjusted for inflation). | |||||
The U.S. Bureau of Economic Analysis (BEA) also provides data on farm income, which is presented below in Table 3-63. The most recent BEA data are from 2008, but 2007 data are also included in the table to facilitate comparison with the Census of Agriculture data (which are only released in years ending in 2 and 7). The 2007 data from BEA is somewhat different from that provided by the Census of Agriculture; for example, BEA’s figures for gross income and net income are somewhat lower than those from the Census. For two of the four counties, this difference results in a negative value for net income reported by BEA, even as the Census reports a positive value for net income. However, the percentage breakouts for percent of income from livestock, crops, other farm-related sources, and government payments are very close to those from the USDA data.
Table 3.63. Farm Income in 2007 and 2008 from the U.S. Bureau of Economic Analysis
| Data Item | Big Horn County | Hot Springs County | Park County | Washakie County |
| Farm Income in 2007 (2007 $ thousands) | ||||
| Gross income | $53,944 | $14,052 | $78,848 | $37,333 |
| Percent of Income from Livestock | 46% | 77% | 56% | 58% |
| Percent of Income from Crops | 38% | 9% | 35% | 36% |
| Percent of Income from Other Sources1 | 12% | 12% | 7% | 4% |
| Percent of Income from Government Payments | 4% | 2% | 1% | 2% |
| Net income | -$6,465 | $312 | -$8,490 | $3,199 |
| Net income including inventory change | -$10,800 | -$1,683 | -$13,047 | $442 |
| Farm Income in 2008 (2008 $ thousands) | ||||
| Gross income | $63,215 | $13,764 | $76,726 | $41,636 |
| Percent of Income from Livestock | 35% | 70% | 40% | 49% |
| Percent of Income from Crops | 49% | 14% | 50% | 44% |
| Percent of Income from Other Sources1 | 12% | 14% | 8% | 4% |
| Percent of Income from Government Payments | 4% | 3% | 2% | 2% |
| Net income | -$3,541 | -$426 | -$10,771 | $5,962 |
| Net income including inventory change | -$1,930 | $246 | -$9,553 | $6,645 |
| Source: BEA 2010a 1Includes the value of home consumption and other farm related income components, such as machine hire and custom work income and income from forest products. This category also includes royalty payments from oil and gas producers to farmers when oil/gas development occurs on farm lands (Kennedy 2008). | ||||
The difference between the BEA and Census (USDA) gross and net income estimates is attributable to different methods and data sources. USDA’s Census data are based on the comprehensive survey of all farm operations that is conducted every 5 years, as described above. BEA annual farm income data (and also farm employment data) are based on county data from the 2002 and 2007 Censuses of Agriculture, annual county data from state offices that are affiliated with the NASS, and data from other sources within the USDA, such as the Farm Service Agency. The BEA generally uses the most detailed information available from the USDA Census of Agriculture; sometimes, this means beginning with data that is tabulated at the state level for a detailed range of commodities, and apportioning it to the county level using data for a less detailed range of commodities, because the county-level data is not available for the more detailed range. Where necessary, the 2003-2006 BEA data use interpolation between the 2002 and 2007 Census of Agriculture, and the 2008 data are based partly on extrapolation (BEA 2010b).
Table 3-64 provides additional information from the 2007 Census of Agriculture on the estimated number of farm employees. The Census of Agriculture provides data on the number of farms with hired workers and, for those farms, the total workers hired and worker payroll. However, the Census does not attempt to calculate total farm employment. The table below shows a series of calculations to estimate farm employment; it makes the key assumption that farms without hired workers have one employee (that is, the farmer). Based on this method, total estimated farm employment in 2007 ranges from about 250 workers in Hot Springs County to 1,700 in Park County. This method produces employment estimates that are greater than those provided in the annual BEA data release for 2007. As described in the paragraph immediately above, this is in part due to different methods and data sources. However, it may also be partly due to different definitions of employment: for instance, people employed for as little as 1 week during the year may be counted as employees for USDA purposes, whereas this arguably should not be considered a job per se. Finally, the assumption that every farm has at least one employee may be somewhat misleading. For instance, some people may argue that the proprietor of a very small operation, such as a market garden or home processing facility, with annual sales just over $1,000 should not be considered to have an employee.
Table 3.64. Estimated Number of Farm Employees, 2007
| Variable | Big Horn County | Hot Springs County | Park County | Washakie County | state of Wyoming |
|---|---|---|---|---|---|
| Number of farms, 2007 | 621 | 180 | 782 | 214 | 11,069 |
| Farms with hired labor | 170 | 35 | 240 | 85 | 2,716 |
| Farms without hired labor | 451 | 145 | 542 | 129 | 8,353 |
| Total workers hired, on farms with hired labor | 621 | 106 | 1,158 | 315 | 9,826 |
| Estimated total farm employment1 | 1,072 | 251 | 1,700 | 444 | 18,179 |
| Worker payroll (for farms with hired labor) | $6.2 | $1.2 | $10.3 | $3.8 | $97.8 |
| Source: USDA 2009, plus additional calculations to estimate total farm employment. Note: Farm revenue and net farm income are in millions of current-year dollars (that is, not adjusted for inflation). 1 Total farm employment is estimated based on the assumption that farms without hired labor have one employee (the farmer). See text for additional information. | |||||
Personal Income
This section describes personal income within the Planning Area. Table 3-65 provides a summary of the sources of personal income by place of work and county in the Planning Area. The table highlights county-level differences in the importance of various economic sectors, as well as the contribution of nonwage income, specifically dividends, interest, and rent, to personal income.
The BEA data that are used to create Table 3-65 do not readily distinguish recreation earnings because these earnings can occur in a variety of sectors, including retail trade, accommodation and food services, and hunting, fishing, and trapping (included in the same row as logging and agricultural services). Subsequent tables and text provide available information on expenditures and sales tax receipts from activities related to travel and tourism, which serve as the closest approximation for recreation.
Table 3.65. Personal Income and Earnings by Place of Work, 2008
| Item/Sector | Big Horn County | Hot Springs County | Park County | Washakie County | state of Wyoming | United States |
| Population | 11,441 | 4,519 | 27,626 | 7,807 | 532,981 | 304,374,846 |
| Total personal income ($ millions) | $340 | $187 | $1,223 | $348 | $25,892 | $12,225,589 |
| Dividends, interest, and rent as a proportion of total personal income1 | 21% | 25% | 32% | 31% | 27% | 18% |
| Dividends, interest, rent, and net transfer payments as proportion of total personal income1 | 33% | 40% | 39% | 38% | 30% | 25% |
| Earnings by place of work ($ millions)1 | $226 | $105 | $761 | $217 | $18,261 | $9,134,834 |
| Percent of total earnings by place of work (by sector) | ||||||
| Farming | 2.4% | 1.4% | 0.8% | 3.9% | 0.4% | 0.8% |
| Fishing, logging, and related activities, including agricultural services2 | N/A3 | N/A3 | 0.4% | N/A3 | 0.3% | 0.3% |
| Mining | 22% | N/A3 | 10% | 12% | 17% | 1% |
| Utilities | 1% | N/A3 | 1% | N/A3 | 1% | 1% |
| Construction | 8% | N/A3 | 10% | 10% | 11% | 6% |
| Manufacturing | 5% | 3% | 3% | 12% | 4% | 11% |
| Wholesale trade | 3% | N/A3 | 2% | N/A3 | 4% | 5% |
| Retail trade | N/A3 | 5% | 9% | 4% | 6% | 6% |
| Transportation and warehousing | 5% | 5% | 2% | 4% | 5% | 3% |
| Information | 2% | 1% | 2% | 2% | 1% | 3% |
| Finance and insurance | 2% | 2% | 4% | 3% | 3% | 8% |
| Real estate and rental and leasing | 0.3% | 1% | 1% | 2% | 2% | 2% |
| Professional and technical services | N/A3 | 4% | 5% | 4% | 5% | 10% |
| Management of companies and enterprises | N/A3 | N/A3 | 0% | N/A3 | 1% | 2% |
| Administrative and waste services | 3% | N/A3 | 2% | N/A3 | 2% | 4% |
| Educational services | 0.1% | 0.4% | 0.2% | N/A3 | 0.4% | 1% |
| Health care and social assistance | 3% | 10% | 10% | N/A3 | 7% | 10% |
| Arts, entertainment, and recreation | 0.3% | 1% | 3% | 1% | 1% | 1% |
| Accommodation and food services | 2% | 5% | 6% | 2% | 4% | 3% |
| Other services, except public administration | 3% | 4% | 3% | 3% | 3% | 4% |
| Government and government enterprises | 31% | 25% | 25% | 21% | 22% | 17% |
| Categories for which data were not disclosed | 9% | 32% | 0% | 18% | 0% | 0% |
| Source: BEA 2010a N/A Not available 1 Earnings by place of work differs from total personal income by the exclusion of dividends, interest, and rent, as well as adjustments to account for net transfer payments (e.g., unemployment benefits and Social Security taxes and payments) and the residential adjustment. 2 “Related activities” includes hunting and trapping, as well as agricultural services such as custom tillage. 3 Data were not disclosed due to confidentiality reasons (Bureau of Economic Analysis does not report data when there are three or fewer employers in a sector). The line item “Categories for which data were not disclosed” shows the total income attributable to these categories for each county. Note The non-disclosures for 2008 were essentially the same as those in 2007, with three exceptions: mining in Hot Springs County (21 percent of 2007 earnings), educational services in Washakie County (0.6 percent of 2007 earnings), and health care and social assistance in Washakie County (10 percent of 2007 earnings). | ||||||
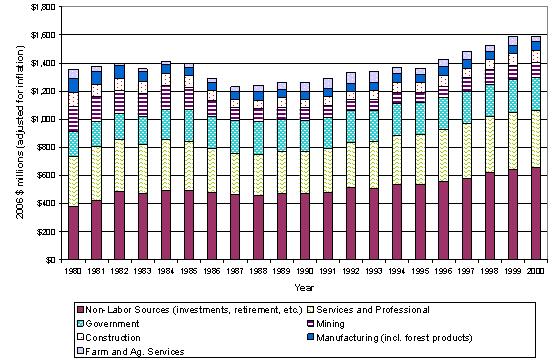
Figure 3-23 shows trend information on sources of income for the four Planning Area counties, aggregated. (Trend information for individual counties is available in the profiles from Headwaters Economics [Headwaters 2007b; Headwaters Economics 2007c; Headwaters Economics 2007a; Headwaters Economics 2007d], which are on the RMP website.) The figure shows trends for 1980 through 2000. Because of a change in the industrial classification system in year 2000, it is not possible to construct a single continuous data set that would provide sector-level data both before and after year 2000.
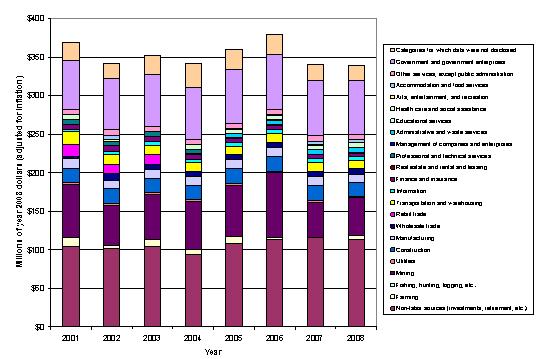
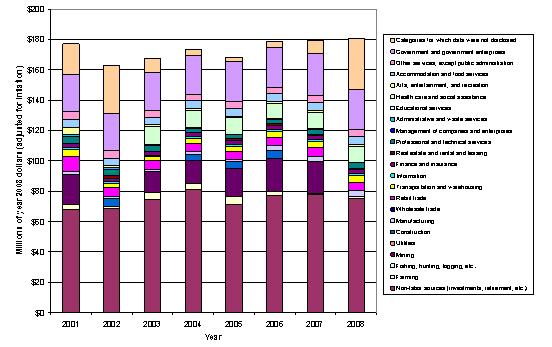
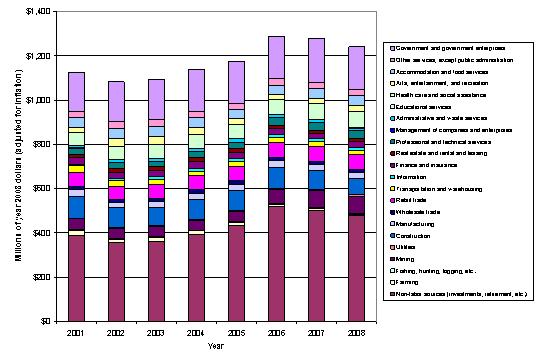
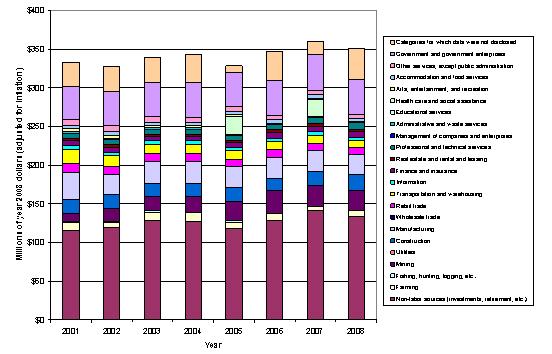
Figures 3-24 through 3-27 show trend information on sources of income for the Planning Area counties from 2001 through 2008. The counties are not aggregated together for this trend data because of the issue of non-disclosure of data. Federal non-disclosure policies prohibit the BEA from releasing earnings data for counties where there are three or fewer employers in a given sector. If there is only one sector in this situation, BEA must also hide data for another sector so as to avoid effective disclosure of the data of concern (since BEA provides sum-of-sectors data as well as individual sectors). The problem of non-disclosure for individual sectors is compounded when attempting to assemble a series across different years and different counties. For instance, while BEA disclosed data for sixteen of the 21 main sectors for Big Horn County in 2001, it disclosed data for only twelve of the 21 sectors for Big Horn County continuously from 2001-2008. With similar disclosure policies applied to the other counties, there are only five sectors for which BEA disclosed data continuously from 2001-2008 for all four counties. Thus, the figures shown here are for each individual county, and show the magnitude of the sectors for which BEA did not disclose data in each year.
(Note that the Headwaters Institute has developed a special algorithm to estimate earnings for these “non-disclosed” sectors for the data series between 1980 and 2000, but has not developed an algorithm to estimate earnings for the 2001-2008 data series.)
Figure 3-23 shows that the change in income from 1980 to 2000 (adjusted for inflation) is largely driven by changes in non-labor income, such as investment income and Social Security payments. The magnitude of income from other sources, adjusted for inflation, remained relatively constant within each sector from 1980 to 2000.
Source: BEA 2010a
Ag. Agricultural
incl. including
Source: BEA 2010a; adjusted for inflation using Wyoming Economic Analysis Division 2010
Source: BEA 2010a; adjusted for inflation using Wyoming Economic Analysis Division 2010
Source: BEA 2010a; adjusted for inflation using Wyoming Economic Analysis Division 2010. Note: Data were disclosed for all sectors in Park County continuously from 2001 to 2008.
Source: BEA 2010a; adjusted for inflation using Wyoming Economic Analysis Division 2010
Although there are particular circumstances in each county, there are some common threads in the four figures above showing income data from 2001 through 2008. Non-labor income sources represent a substantial, and generally growing, share of income in all four counties. The variation in non-labor income over time is generally the biggest influence on total income. Mining is also a sector for which there is both a substantial amount of variation over time, and the mining sector contributes to changes in total income in all four counties. Other sectors, most notably construction, retail trade, health care and social assistance, accommodation and food services, and government, contribute a noticeable share in all or virtually all years, but these tend to be fairly steady over time. Note that the effects of non-disclosure are readily visible in the charts above: for instance, mining earnings were not disclosed in Hot Springs County in 2002 or 2008, and health care and social assistance were disclosed for Washakie County only in 2005 and 2007. These and other variations in disclosure are evident when a sector has widely divergent earnings in different years in the same county.
Table 3-66 provides a summary of mining-related earnings and employment for the Planning Area counties for detailed sub-industry sectors, for the latest year these data are available (2007). The table shows that oil and gas mining and support activities related to oil and gas contribute the majority of mining employment and payroll in Hot Springs, Park, and Washakie counties. In Big Horn County, a sizable amount of mining-related employment is also attributable to the mining of non-metallic minerals (e.g., bentonite).
Table 3.66. Earnings and Employment for Mining Activities (2007)
| Source | Big Horn County | Hot Springs County | Park County | Washakie County | ||||
| Employees | Payroll ($000)1 | Employees | Payroll ($000)1 | Employees | Payroll ($000)1 | Employees | Payroll ($000)1 | |
| Mining | 435 | 16,758 | 397 | 16,646 | 555 | 25,752 | 125 | 6,099 |
| Oil and Gas Extraction | 20-99 | N/A2 | 20-99 | N/A2 | 356 | 15,583 | 20-99 | N/A2 |
| Mining (Except Oil and Gas) | 100-249 | N/A2 | 0-19 | N/A2 | 0 | 0 | 20-99 | N/A2 |
| Coal Mining | 0-19 | N/A2 | 0 | 0 | 0 | 0 | 0 | 0 |
| Metal Ore Mining | 0 | 0 | 0 | 0 | 0 | 0 | 0 | 0 |
| Nonmetallic Mineral Mining and Quarrying | 100-249 | N/A2 | 0-19 | N/A2 | 0 | 0 | 20-99 | N/A2 |
| Mining Support Activities | 100-249 | N/A2 | 360 | 14,705 | 100-249 | N/A2 | 20-99 | 3,408 |
| Drilling Oil and Gas Wells | 0 | 0 | 100-249 | N/A2 | 0-19 | N/A2 | 0-19 | 336 |
| Oil and Gas Operations Support Activities | 100-249 | N/A2 | 192 | 11,932 | 100-249 | N/A2 | 45 | 2,361 |
| Support Activities for Coal Mining | 0 | 0 | 0 | 0 | 0 | 0 | 0 | 0 |
| Support Activities for Metal Mining | 0 | 0 | 0 | 0 | 0 | 0 | 0 | 0 |
| Nonmetallic Minerals Support Activity (Except Fuels) | 0 | 0 | 0 | 0 | 0 | 0 | 0-19 | N/A2 |
| Source: US Census Bureau 2009c. Number of employees is for week ending March 12, 2007. Payroll data (in thousands of dollars) are for the entire year.1For most sectors, the data source reveals a range rather than an exact number of employees so as not to disclose confidential business information (because there are relatively few employers in the sector).2The data source does not reveal data on payrolls for this sector due to confidentiality requirements (there are relatively few employers in the sector).N/Anot available | ||||||||
Employment
Table 3-67 provides a summary of employment by sector for the counties in the Planning Area. The breakout is comparable to the earnings table above; in most of the counties, substantial portions of employment are derived from mining, construction, retail trade, and government. However, the differences between the two tables highlight the divergence in earnings per job in different sectors. For example, whereas mining contributes 22 percent of earnings in Big Horn County, it contributes proportionally fewer jobs (11 percent), which illustrates the relatively high wages per job in the mining sector. Similarly, retail trade accounts for 13 percent of jobs in Park County and 9 percent of jobs in each of Hot Springs and Washakie counties, but contributes just 9 percent of earnings in Park County, and 5 to 6 percent in Hot Springs and Washakie. This divergence indicates that wages per job in this sector are relatively low, either because of lower wages per hour or because some jobs in the sector are seasonal or part-time. For information on seasonal variations in employment, see the discussion of Transient and Seasonal Populations in Section 3.8.1 Social Conditions.
Note that the data in the table below are from BEA. As noted above under the “Economic Activity: Livestock Grazing” header in this section, BEA’s data on agricultural operations differ from USDA Census of Agriculture data. As relates to employment, the number of farm employees reported by BEA is generally lower than that reported in the Census of Agriculture. According to the estimates in Table 3-64, Big Horn County had 1,072 farm employees, Hot Springs had 251, Park had 1,700, and Washakie had 444, in 2007. As noted, the Census of Agriculture is conducted only every 5 years, with the next one scheduled to occur in 2012. However, the 2007 comparison suggests that the Census of Agriculture would indicate a higher proportion of total employment attributable to farms than is indicated by the BEA data in the table immediately below.
Table 3.67. Employment by Sector, 2008
| Sector | Big Horn County | Hot Springs County | Park County | Washakie County | state of Wyoming | United States |
|---|---|---|---|---|---|---|
| Farm employment | 11% | 6% | 4% | 5% | 3% | 1.5% |
| Fishing, hunting, logging, and related activities, including agricultural services1 | N/A | N/A | 1% | N/A | 0.7% | 0.5% |
| Mining | 11% | N/A | 4% | 5% | 8% | 0.6% |
| Utilities | 0.4% | N/A | 0.4% | N/A | 0.6% | 0.3% |
| Construction | 8% | N/A | 9% | 9% | 10% | 6% |
| Manufacturing | 4% | 3% | 3% | 8% | 3% | 8% |
| Wholesale trade | 3% | N/A | 2% | N/A | 2% | 4% |
| Retail trade | N/A | 9% | 13% | 9% | 10% | 10% |
| Transportation and warehousing | 3% | 3% | 2% | 3% | 4% | 3% |
| Information | 2% | 2% | 1% | 1% | 1.2% | 2% |
| Finance and insurance | 3% | 3% | 4% | 4% | 3% | 5% |
| Real estate and rental and leasing | 3% | 4% | 5% | 4% | 5% | 5% |
| Professional and technical services | N/A | 4% | 5% | 4% | 4% | 7% |
| Management of companies and enterprises | N/A | N/A | 0% | N/A | 0.2% | 1.1% |
| Administrative and waste services | 4% | N/A | 3% | N/A | 3% | 6% |
| Educational services | 0.5% | 1% | 1% | N/A | 0.8% | 2% |
| Health care and social assistance | 4% | 10% | 8% | N/A | 7% | 10% |
| Arts, entertainment, and recreation | 1% | 3% | 3% | 1% | 2% | 2% |
| Accommodation and food services | 4% | 10% | 10% | 6% | 8% | 7% |
| Other services, except public administration | 4% | 7% | 5% | 5% | 5% | 6% |
| Government and government enterprises | 22% | 18% | 17% | 15% | 18% | 14% |
| Categories for which data were not disclosed | 12% | 19% | 0% | 20% | 0% | 0% |
| Total employment (number of jobs) | 6,870 | 3,297 | 21,167 | 5,887 | 404,855 | 181,755,100 |
| Source: BEA 2010a N/A not available 1 Related activities includes hunting and trapping, as well as agricultural services such as custom tillage. | ||||||
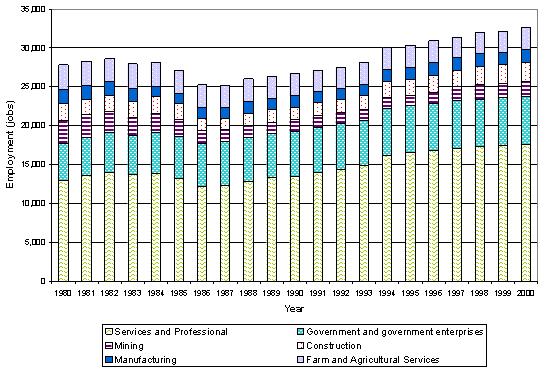
Figure 3-28 shows historical employment trends for the four Planning Area counties, aggregated. (Trend information for individual counties is available in the profiles from Headwaters Economics (Headwaters 2007b; Headwaters Economics 2007c; Headwaters Economics 2007a; Headwaters Economics 2007d), which are on the RMP website.) The figure shows trends for 1980 through 2000. As noted above, due to a change in the industrial classification system in year 2000, and federal non-disclosure policies, it is not possible to construct a table or graph with meaningful trend information after year 2000. The data in the figure indicate that the number of jobs in the services and professional sectors accounted for the majority of changes in employment from 1980 to 2000. Mining jobs were higher in the early 1980s and mid to late 1990s, while government sector jobs grew somewhat starting in the mid to late 1980s. The number of jobs in other sectors remained relatively stable from 1980 to 2000.
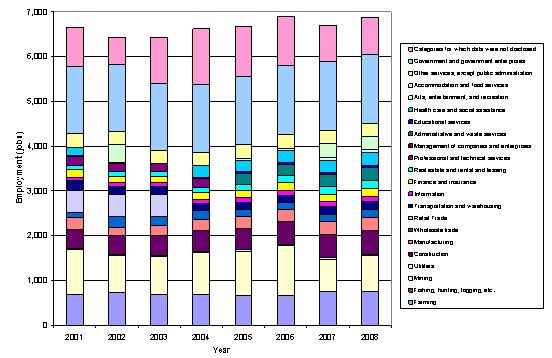
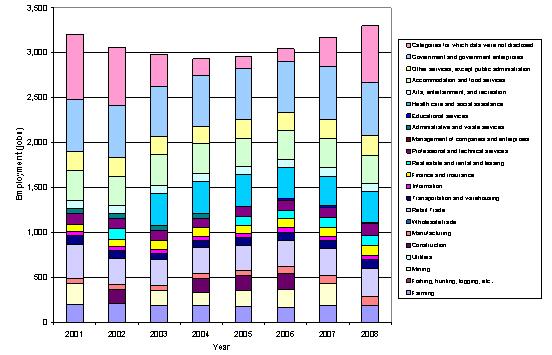
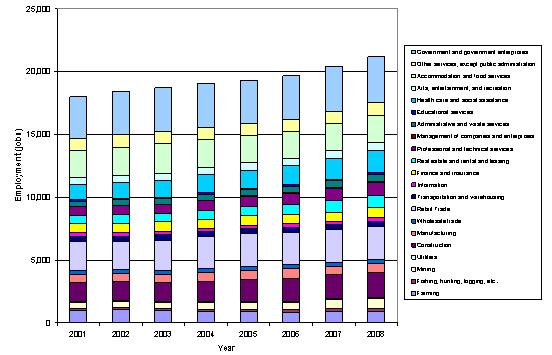
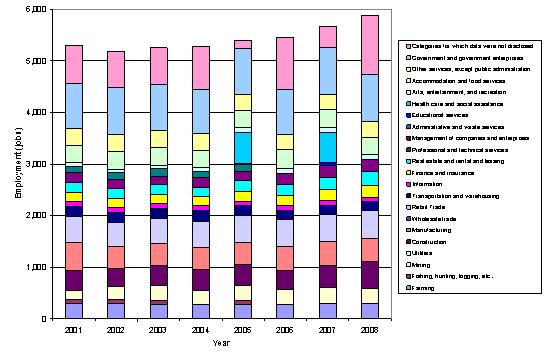
Figures 3-29 through 3-32 show trend information on sources of employment from 2001 through 2008. Similar to the income figures above, and for the same reasons, the counties are not aggregated for this trend data because of the issue of non-disclosure of data. The figures shown here are for each individual county, and show the magnitude of the sectors for which BEA did not disclose data in each year.
Source: BEA 2010a
Source: BEA 2010a
Source: BEA 2010a
Source: BEA 2010a.
Note: Data were disclosed for all sectors in Park County continuously from 2001 to 2008.
Like the income figures, there are particular circumstances in each county but there are some common threads in the 2001-2008 employment trends. In general, certain sectors provide a steady source of employment with little variation over time: farming, accommodation and food services, retail trade, construction, manufacturing, and government. In Park County, the increase in employment over time is attributable to slight increases in construction, retail trade, and health care and social assistance. Park, Washakie, and Hot Springs Counties all saw small, steady increases in employment for 2002-2008, but there is no obvious driver (partly because the intermittent nondisclosure makes it difficult to determine trends over time, but partly because there were no large jumps in employment for any sector during that period). Note that, like the income figures, the effects of non-disclosure are readily visible when a sector has widely divergent employment numbers in different years within the same county.
Table 3-68 shows three different measures of earnings and income for the Planning Area counties, using the most recent available data. On all three earning and income measurements, income and earnings in the Planning Area counties are lower than for the state as a whole. In addition, median household income and average earnings per job are lower in the Planning Area counties than in the United States. Per capita income is lower than the national average in Big Horn County, but greater than the national average in the other three counties. The relative difference between average earnings per job (which measures employment income only) and per capita income (which also includes dividends, interest, rent, and transfer payments such as Social Security) in Hot Springs, Park, and Washakie Counties underscores the importance of nonwage income in these counties, which is also identified above in the earnings data.
Table 3.68. Average and Median Income; Average Earnings Per Job
| Area | Per Capita Income(2008) | Average Earnings Per Job (2008) | Median Household Income (2009) |
| Big Horn County | $29,724 | $32,939 | $44,304 |
| Hot Springs County | $41,482 | $31,991 | $40,310 |
| Park County | $44,270 | $35,938 | $47,803 |
| Washakie County | $44,545 | $36,916 | $47,475 |
| state of Wyoming | $48,580 | $45,106 | $54,735 |
| United States | $40,166 | $50,259 | $52,029 |
| Sources: BEA 2010a (per capita income and average earnings per job); US Census Bureau 2009d (median household income) | |||
Table 3-69 shows the unemployment rate for counties in the Planning Area compared to state and national levels. As the table shows, unemployment in the Planning Area counties from 2006 through April 2010 has been lower than in the United States, though greater than the statewide rate in 2006-2008. While the national unemployment rate ticked up in 2008, unemployment remained steady in the Planning Area counties. Between 2008 and April 2010, unemployment in the Planning Area counties has increased, particularly in Big Horn County.
Table 3.69. Unemployment Rate in 2006-2010
| Area | Unemployment Rate, 2006 (annual average) | Unemployment Rate, 2007 (annual average) | Unemployment Rate, 2008 (annual average) | Unemployment Rate, 2009 (annual average) | Unemployment Rate, 2010 (April)1 |
| Big Horn County | 4.3% | 4.2% | 4.2% | 8.7% | 7.7% |
| Hot Springs County | 3.7% | 3.4% | 3.4% | 6.0% | 5.2% |
| Park County | 3.7% | 3.2% | 3.7% | 6.2% | 7.3% |
| Washakie County | 3.7% | 3.6% | 3.7% | 6.2% | 6.8% |
| state of Wyoming | 3.2% | 2.9% | 3.2% | 6.4% | 7.2% |
| United States | 4.6% | 4.6% | 5.8% | 9.3% | 9.5% |
| Sources: BLS 2010a; BLS 2010b1April 2010 rate is not seasonally adjusted. | |||||
Spatial Distribution of Employment
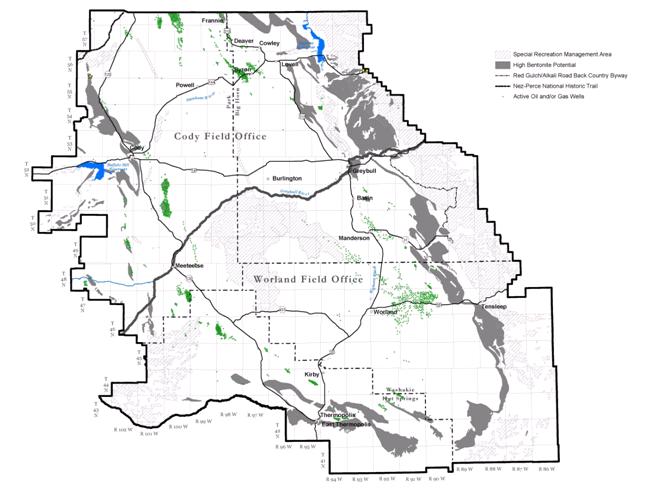
Some features of the economic landscape are common to the communities within the Planning Area, while in other ways the communities vary in their employment base. In all the communities, BLM land influences employment (directly, indirectly, or both) as well as other quality of life factors. To elucidate the geo-spatial employment patterns, Figure 3-33 shows the geographic dispersion of certain critical BLM uses, including SRMAs, areas of high bentonite potential, and active oil and gas wells. The Planning Area is authorized for livestock grazing, except for the areas shown on Map 65.
Oil and gas deposits occur throughout the basin. Nearly every community lies within twenty miles from at least one cluster of active oil and gas wells; Powell and Burlington are the only exceptions. The largest clusters of oil and gas wells are proximate to Worland, Cody, and the towns in the northwest corner of Big Horn County (Byron, Lovell, Cowley, Deaver, and Frannie). Livestock grazing, as it is coterminous with BLM-administered surface, also occurs throughout the Planning Area, and all the communities are located very close to some area used for grazing. SRMAs, representing key recreational areas administered by the BLM, are concentrated in the center of the basin (near Burlington, Meeteetse, Manderson, and Kirby) and on the eastern edge (the Big Horn Mountains, near Lovell, Greybull, Worland, and Ten Sleep). Areas of high bentonite potential occur on the edges of the basin, particularly in Big Horn and Washakie Counties (which together account for a large portion of the state’s bentonite production).
To supplement the figure, Table 3-70 shows the distribution of employment for the larger communities in the Planning Area. Unfortunately, the only data source that provides information about sector-level employment at the resolution of individual communities is the 2000 Census, which means these data are relatively old. In addition, the Census tabulation for this data item is based on a 1-in-6 sample, which means that data tabulated for very small communities has a substantial amount of error. For instance, a community with 300 residents would have about 50 people responding to the survey; if only 35 of those people are of working age, and they work in fifteen different employment sectors, then an aberration in the sample (e.g., three people who work in the construction industry, and none who work in mining) can suggest a population-level effect that does not actually hold true. For this reason, Table 3-70 shows only data for towns with greater than 600 employed people in the year 2000.
As expected, the data show some similarities in employment patterns. The service sectors, especially education, health care, and social assistance, and the retail trade sector contribute a sizable proportion of employment in all of the communities shown. Among sectors that are influenced directly by BLM actions, mining is most important in Greybull and Lovell; agriculture provides a small but important contribution to employment in all of the communities (with Worland and Powell having the largest shares), and recreation, accommodation, and food services, which is combined with arts and entertainment in the Census tabulation, provides a sizable share of employment in all of the communities (12 to 16 percent in all of the communities shown except Lovell).
Table 3.70. Employment by Sector, 2000
| Sector | Cody | Greybull | Lovell | Powell | Thermo-polis | Worland |
|---|---|---|---|---|---|---|
| Agriculture, forestry, fishing and hunting | 3% | 2% | 4% | 5% | 2% | 5% |
| Mining | 3% | 9% | 10% | 3% | 3% | 8% |
| Construction | 8% | 8% | 10% | 4% | 8% | 6% |
| Manufacturing | 7% | 2% | 9% | 4% | 3% | 9% |
| Wholesale trade | 1% | 2% | 1% | 4% | 1% | 3% |
| Retail trade | 15% | 15% | 11% | 11% | 7% | 12% |
| Transportation and warehousing, and utilities | 4% | 9% | 3% | 5% | 6% | 4% |
| Information | 2% | 3% | 1% | 3% | 3% | 2% |
| Finance, insurance, real estate and rental and leasing | 6% | 6% | 4% | 6% | 5% | 4% |
| Professional, scientific, management, administrative, and waste management services | 8% | 3% | 2% | 6% | 2% | 5% |
| Educational services | 7% | 10% | 12% | 15% | 13% | 6% |
| Health care and social assistance | 13% | 8% | 17% | 15% | 22% | 13% |
| Arts, entertainment, recreation, accommodation and food services | 13% | 14% | 7% | 12% | 16% | 12% |
| Other services (except public administration) | 6% | 4% | 6% | 4% | 6% | 6% |
| Public administration | 4% | 5% | 4% | 2% | 4% | 5% |
| Total employment (number of jobs) | 4,266 | 808 | 959 | 2,413 | 1,525 | 2,422 |
| Source: US Census Bureau 2000 | ||||||
Cost of Living
One factor that affects economic and social trends within the communities is the cost of living. The Wyoming Economic Analysis Division calculates relative changes in cost of living over time by estimating the cost of a set of goods and services that represents the average consumer’s purchases for housing, food, health care, travel costs, and other items. If the cost of living for a particular area increases faster than average income, that may mean that long-time residents, especially those on fixed incomes, may find their lifestyle less affordable over time. Over a long period of time, a higher cost of living may encourage people to relocate from a community and discourage migration into a community by households not seeking to relocate in conjunction with employment opportunities. Overall migration into the area will likely decrease, and the demographic and socioeconomic characteristics of those who move in will be determined partially by the cost of living in the area.
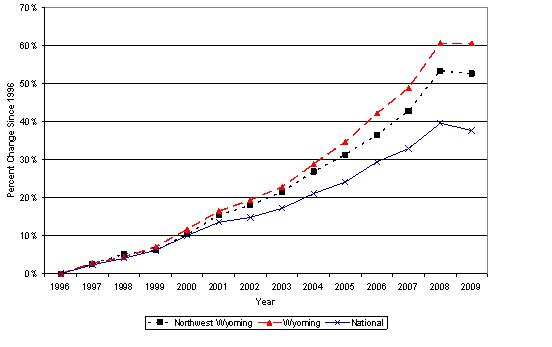
The Wyoming Economic Analysis Division (Wyoming Economic Analysis Division 2010) calculates the change in the cost of living over time for a five-county region in northwest Wyoming, consisting of Big Horn, Hot Springs, Park, Teton, and Washakie Counties. Figure 3-34 shows how the cost of living in northwest Wyoming has changed relative to the cost of living in Wyoming generally and in the United States. Starting around 2000, the cost of living in the northwest region and Wyoming as a whole began to increase at a greater rate than the nation. The cost of living in the northwest region has risen slightly more slowly than for the state as a whole. By 2008, compared to 1996, the cost of living in northwest Wyoming had risen by about 55 percent, compared to 60 percent statewide and 40 percent for the United States. It is worth noting that the inclusion of Teton County in the five-county region may bias the results upward, due to the higher cost of living in Jackson and other portions of Teton County. In other words, the rise in the cost of living for the four counties of the combined Cody and Worland Planning Area is likely to be lower than that suggested by the five-county region that also includes the affluent Teton County. In 2009, the cost of living declined slightly for all three geographic regions shown in the figure, as a result of the housing market decline and the nationwide recession.
Source: Wyoming Economic Analysis Division 2010
Housing
Housing stock within the Planning Area has grown steadily in all four counties since 2001, but only in Park County has the growth been appreciable (see Table 3-71). Unfortunately, the most recent data on vacancy rates for all housing at the county level is from the 2000 Census. These data are presented in Table 3-72, which also provides data on the percentage of housing that is occupied by renters and owners. This section also presents, later, updated data on rental vacancy rates.
Table 3.71. Housing Units, 2001-2008
| County | 2001 | 2002 | 2003 | 2004 | 2005 | 2006 | 2007 | 2008 |
| Big Horn | 5,126 | 5,135 | 5,153 | 5,186 | 5,214 | 5,210 | 5,220 | 5,229 |
| Hot Springs | 2,545 | 2,547 | 2,552 | 2,563 | 2,569 | 2,569 | 2,571 | 2,573 |
| Park | 12,034 | 12,137 | 12,291 | 12,474 | 12,684 | 12,846 | 13,073 | 13,285 |
| Washakie | 3,667 | 3,670 | 3,675 | 3,677 | 3,686 | 3,688 | 3,691 | 3,708 |
| Source: Wyoming Economic Analysis Division 2009b | ||||||||
Table 3-72 shows that about 70 to 75 percent of housing is owner occupied in all four counties. Vacancy rates in 2000 were highest in Big Horn and Hot Springs Counties, where about one in six houses were vacant, and lowest in Washakie County, where about one in ten houses were vacant. The year 2000 vacancy rates suggest there was sufficient housing stock to accommodate new residents, at least in the aggregate.
Table 3.72. Housing Occupancy Status in 2000
| County | Number of Housing Units | Percent Occupied | Percent Vacant | Percent Owner Occupied | Percent Renter Occupied |
|---|---|---|---|---|---|
| Big Horn | 5,105 | 84% | 16% | 75% | 25% |
| Hot Springs | 2,536 | 83% | 17% | 68% | 32% |
| Park | 11,869 | 87% | 13% | 71% | 29% |
| Washakie | 3,654 | 90% | 10% | 73% | 27% |
| Source: US Census Bureau 2000 | |||||
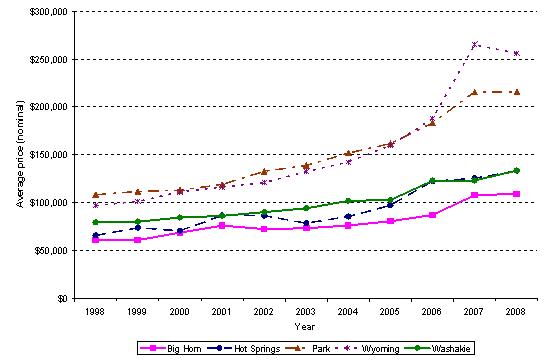
Table 3-73 shows average housing prices for the Planning Area counties from 1998-2008, based on sales of existing, detached single family homes on 10 acres or less sold during the previous calendar year (WHDP 2009b; WHDP 2009a).
Figure 3-35 shows the same information graphically. The table and figure show that housing prices in the Planning Area counties have increased in generally parallel fashion (i.e., growing at about the same rate), although with prices consistently higher in Park County than the other three counties. The 2008 data show a dip in housing prices statewide due to the economic contraction, but housing prices in the Planning Area counties rose in Big Horn, Hot Springs, and Washakie Counties, and stayed virtually the same in Park County.
Table 3.73. Average Housing Price, 1998-2008
| Year | Big Horn County | Hot Springs County | Park County | Washakie County | state of Wyoming |
|---|---|---|---|---|---|
| 1998 | $61,088 | $66,044 | $108,286 | $79,433 | $96,906 |
| 1999 | $61,022 | $74,022 | $111,893 | $80,338 | $101,517 |
| 2000 | $68,816 | $70,625 | $113,178 | $84,564 | $111,437 |
| 2001 | $76,263 | $86,840 | $119,233 | $86,412 | $116,469 |
| 2002 | $72,670 | $86,625 | $132,854 | $90,405 | $121,140 |
| 2003 | $73,526 | $78,705 | $138,941 | $94,206 | $132,708 |
| 2004 | $76,279 | $85,615 | $151,921 | $102,144 | $142,501 |
| 2005 | $80,607 | $97,453 | $161,866 | $102,948 | $159,776 |
| 2006 | $87,384 | $122,544 | $183,326 | $123,072 | $187,869 |
| 2007 | $107,966 | $125,576 | $215,697 | $123,363 | $265,044 |
| 2008 | $109,295 | $133,421 | $215,692 | $133,754 | $256,045 |
| Number of Sales in 2008 | 96 | 67 | 287 | 119 | 5,849 |
| Source: WHDP 2009b; WHDP 2009a Note: Prices are the average for all existing detached single family homes on 10 acres or less sold during the previous calendar year, and are not adjusted for inflation. | |||||
Source: WHDP 2009b; WHDP 2009a
Table 3-74 shows information about rental housing availability (i.e., rental vacancy rates) since 2001. Vacancy rates in all four counties were somewhat volatile between 2001 and 2009, with some low years and some higher years. In 2007, vacancy rates in Big Horn, Park, and Washakie Counties were generally low, except in December in Washakie County, but in 2008 they rose again. This increase generally continued in 2009, with some exceptions, such as the lower rate in Hot Springs County in June/July 2009. This may reflect the economic downturn that began in late 2008.
Table 3.74. Rental Housing Availability
| Year | Big Horn County | Hot Springs County | Park County | Washakie County | |||||
|---|---|---|---|---|---|---|---|---|---|
| June/July | December | June/July | December | June/July | December | June/July | December | ||
| 2001 | 12.2 | 12.1 | 5.4 | 6.4 | 3.6 | 6.4 | 4.9 | 9.5 | |
| 2002 | 4.4 | 4.7 | 11.0 | 11.7 | 5.8 | 4.5 | 10.2 | 6.3 | |
| 2003 | 6.9 | 5.0 | 10.6 | 9.9 | 2.5 | 6.9 | 5.9 | 6.3 | |
| 2004 | 8.6 | 11.0 | 6.8 | 4.7 | 5.4 | 10.7 | 1.6 | 1.1 | |
| 2005 | 6.2 | 8.4 | 8.3 | 6.8 | 3.3 | 5.2 | 3.1 | 1.6 | |
| 2006 | 6.8 | 3.3 | 4.4 | 8.5 | 1.6 | 3.3 | 1.5 | 0.0 | |
| 2007 | 2.1 | 1.5 | 5.4 | 5.3 | 1.0 | 2.7 | 1.0 | 7.3 | |
| 2008 | 3.0 | 4.7 | 9.3 | 5.9 | 2.9 | 3.4 | 3.7 | 2.7 | |
| 2009 | 4.9 | 14.2 | 5.9 | 8.1 | 2.8 | 3.5 | 3.9 | 3.5 | |
| Source: WHDP 2009b; WHDP 2009aNote: Availability is measured in percentage terms (percent of units that are vacant) based on a survey of rental agencies. | |||||||||
Source: WHDP 2009b; WHDP 2009a
Note: Availability is measured in percentage terms (percent of units that are vacant) based on a survey of rental agencies.
Table 3-75 provides some additional economic variables of interest. The ratio of relatively low-income households to relatively high-income households, which provides an indication of income inequality, is higher in Big Horn and Hot Springs Counties than the median for all U.S. counties (indicating a more unequal income distribution), and lower in Park and Washakie Counties (indicating a more equal distribution of income). The index of employment specialization is substantially higher in Big Horn and Hot Springs Counties than the median for all U.S. counties, which indicates that employment in these counties is relatively concentrated in a small number of industry sectors. The same index shows that employment in Park and Washakie Counties is slightly more diversified than in the United States as a whole. This kind of diversification can help to moderate boom and bust cycles when those cycles affect particular industries more than others. Finally, the net residential adjustment shows the degree to which commuting across county borders affects work-related earnings. Hot Springs County had a positive residential adjustment in 2005, indicating that more people commute out of the county to work (the county is a “bedroom community”). The other counties in the Planning Area had negative residential adjustments, indicating that more people commute into the county to work.
Table 3.75. Poor-Rich Ratio, Employment Specialization, and Residential Adjustment
| Area | Poor-Rich Ratio (1999)1 | Employment Specialization Index (2005)1 | Net Residential Adjustment (2005)3 |
|---|---|---|---|
| Big Horn County | 11.8 | 267 | -2.0% |
| Hot Springs | 11.9 | 321 | 4.2% |
| Park County | 7.8 | 146 | -1.0% |
| Washakie County | 6.0 | 139 | -1.1% |
| Median of United States counties4 | 9.0 | 155 | N/A |
| Source: Headwaters 2007b; Headwaters Economics 2007c; Headwaters Economics 2007a; Headwaters Economics 2007d 1 Measures the ratio of households with income less than $30,000 to those with income exceeding $100,000 (in year 1999). For instance, a ratio of 10 indicates there are 10 households with income less than $30,000 for every household with income over $100,000. 2 A relative measure of the diversity of the employment base of a county compared to the employment base of the United States as a whole. A lower index indicates a more diverse employment base; a higher index indicates greater specialization (employment is more concentrated in a few economic sectors). 3 A positive residential adjustment indicates that more people commute out of the county to work, while a negative adjustment indicates that more people commute into the county to work. The numeric value is the net proportion of total personal income that is earned across county lines. 4 Represents the median for all counties in the United States (not the median value for the United States as a whole). | |||
Tax Revenues
Economic activities on BLM-administered land and mineral estate contribute to the fiscal well-being of local governments, as well as to state and federal governments. The BLM’s management actions have the potential to affect tax revenues from mining and mineral production; travel, tourism, and recreation; and livestock grazing and ranching.
Mineral Severance Taxes
The mining industry contributes substantially to state and local tax revenues. For example, the Wyoming State Auditor (Wyoming State Auditor 2010) reported that state mineral severance taxes and federal mineral royalties returned to the state represented 49 percent of total state revenues in Fiscal Year 2009 – a total of $1.63 billion. Table 3-76 shows estimated state severance tax collections for the Planning Area counties and Wyoming for production year 2008.
Table 3.76. Estimated State Severance Tax Collections in the Planning Area Counties, for Production Year 2008
| Mineral | Big Horn County | Hot Springs County | Park County | Washakie County | state of Wyoming |
|---|---|---|---|---|---|
| Crude and Stripper Oil | $5,889,644 | $8,553,150 | $22,503,384 | $2,224,185 | $153,351,225 |
| Natural Gas | $815,888 | $112,056 | $4,516,179 | $768,977 | $720,207,059 |
| Coal | $0 | $485 | $0 | $0 | $261,614,043 |
| Gypsum | $14,816 | $0 | $20,990 | $0 | $39,728 |
| Sand and Gravel | $1,330 | $624 | $14,816 | $2,435 | $617,268 |
| Bentonite | $733,558 | $1,695 | $0 | $35,014 | $1,162,469 |
| Additional Minerals | $0 | $0 | $0 | $0 | $17,365,822 |
| Total | $7,455,236 | $8,668,010 | $27,055,369 | $3,030,611 | $1,154,816,806 |
| Source: Wyoming DOR 2010 Note: The figure for oil reflects the application of various tax incentive statutes which resulted in a reduced severance tax collection. The data shown were calculated using actual severance taxes paid as of August 2009 (Wyoming DOR 2010). | |||||
Federal mineral royalties are levied at 12.5 percent of the value of current oil and gas and coal production, after allowable deductions. Half the royalties collected are returned to the state of Wyoming, and a portion of the royalties received by the state are disbursed to cities and towns (state of Wyoming 2004). According to the Wyoming Consensus Revenue Estimating Group (CREG), federal mineral royalties for production in the state were $927 million in Fiscal Year 2007, $1,186 million in Fiscal Year 2008, and $1,050 million in Fiscal Year 2009 (CREG 2009). This includes royalties from oil, gas and gas plant products, and coal, including coal lease bonuses. The CREG projects lower royalty revenue for the next several fiscal years due to reduced drilling activity from the national recession and other factors (CREG 2009).
Local counties and communities receive severance taxes and federal mineral royalties. Table 3-77 lists the federal mineral royalties disbursements received by the Planning Area counties between 2004 and 2009, and Table 3-78 lists severance tax disbursements to these counties during that same period. Small amounts of state severance taxes are also distributed to towns, but are not included in these figures.
Table 3.77. Disbursements of Federal Mineral Royalties by Planning Area Counties, for Production Years 2004-2009
| Fiscal Year | Big Horn County | Hot Springs County | Washakie County | Park County | Total |
| 2004 | $2,555,612 | $3,327,735 | $1,491,388 | $9,220,666 | $16,595,401 |
| 2005 | $4,656,727 | $4,470,292 | $1,651,277 | $12,243,560 | $23,021,856 |
| 2006 | $4,945,953 | $6,025,658 | $4,659,127 | $19,098,545 | $34,729,283 |
| 2007 | $3,688,612 | $7,249,080 | $3,302,493 | $15,814,298 | $30,054,483 |
| 2008 | $6,127,423 | $11,510,917 | $4,568,479 | $24,614,706 | $46,821,524 |
| 2009 | $4,163,525 | $7,614,451 | $2,485,727 | $15,301,272 | $29,564,975 |
| Source: Schaeffer 2010 | |||||
Table 3.78. Disbursements of Severance Tax by Planning Area Counties, for Production Years 2004-2009
| Fiscal Year | Big Horn County | Hot Springs County | Washakie County | Park County | Total |
| 2004 | $176,732 | $133,476 | $169,798 | $289,455 | $769,461 |
| 2005 | $164,947 | $106,791 | $150,672 | $303,648 | $726,057 |
| 2006 | $173,411 | $115,818 | $163,855 | $312,518 | $765,602 |
| 2007 | $178,450 | $117,265 | $174,591 | $317,072 | $787,378 |
| 2008 | $169,861 | $108,850 | $163,584 | $306,868 | $749,163 |
| 2009 | $156,170 | $94,806 | $146,158 | $291,446 | $688,580 |
| Source: Wyoming State Treasurer’s Office 2010 | |||||
Property Tax and Sales Tax Base (Tax Revenues)
Another way to look at the contributions of different industries in the Planning Area is to consider how different economic sectors contribute to local and state property values for the purpose of property tax levies, and also to local and state sales taxes. The fiscal stability of local and state government, as well as the economic viability of communities themselves, depends on the viability and stability of local industry and commerce. Table 3-79 shows local and state assessed property valuation in 2009 for the Planning Area counties and Wyoming. Table 3-80 shows local and state sales tax revenues by sector for each of the counties.
Table 3.79. Local and State Assessed Property Valuation, 2009
| County | Total ($ millions) | Agricultural | Residential | Commercial | Mineral | Industrial |
|---|---|---|---|---|---|---|
| Local Assessed Valuation | ||||||
| Big Horn County | $85 | 15% | 58% | 13% | 3% | 11% |
| Hot Springs County | $43 | 7% | 60% | 17% | 15% | 1% |
| Park County | $337 | 4% | 75% | 15% | 3% | 2% |
| Washakie County | $75 | 8% | 60% | 17% | 5% | 10% |
| state of Wyoming | $7,715 | 3% | 58% | 14% | 23% | 2% |
| State Assessed Valuation | ||||||
| Big Horn County | $223 | 0% | 0% | 0% | 93% | 7% |
| Hot Springs County | $239 | 0% | 0% | 0% | 97% | 3% |
| Park County | $696 | 0% | 0% | 0% | 98% | 2% |
| Washakie County | $82 | 0% | 0% | 0% | 89% | 11% |
| state of Wyoming | $21,505 | 0% | 0% | 0% | 95% | 5% |
| Total (State and Local) Assessed Valuation | ||||||
| Big Horn County | $308 | 4% | 16% | 4% | 69% | 8% |
| Hot Springs County | $283 | 1% | 9% | 3% | 84% | 3% |
| Park County | $1,033 | 1% | 25% | 5% | 67% | 2% |
| Washakie County | $156 | 4% | 29% | 8% | 49% | 11% |
| state of Wyoming | $29,220 | 1% | 15% | 4% | 76% | 4% |
| Source: Wyoming DOR 2010 | ||||||
Table 3.80. State and Local Sales Tax Collections by Sector, 2009
| Sector | Big Horn County | Hot Springs County | Park County | Washakie County | state of Wyoming |
|---|---|---|---|---|---|
| Agriculture, Forestry, Fishing, and Hunting | 0.03% | 0% | 0.2% | 0.1% | 0.04% |
| Mining | 7% | 11% | 4% | 5% | 18% |
| Utilities | 12% | 9% | 6% | 8% | 4% |
| Construction | 2% | 2% | 2% | 1% | 3% |
| Manufacturing | 3% | 2% | 3% | 3% | 4% |
| Wholesale Trade | 14% | 10% | 6% | 9% | 12% |
| Retail Trade | 33% | 33% | 42% | 39% | 33% |
| Transportation and Warehousing | 0.03% | 0.1% | 0.1% | 0.005% | 0.2% |
| Information | 5% | 3% | 3% | 4% | 2% |
| Financial Activities | 3% | 3% | 3% | 4% | 5% |
| Professional and Business Services | 0.9% | 0.3% | 1% | 1% | 1% |
| Educational and Health Services | 0.01% | 0.04% | 0.1% | 0.04% | 0.1% |
| Leisure and Hospitality | 6% | 15% | 18% | 8% | 9% |
| Other Services | 4% | 4% | 3% | 5% | 5% |
| Public Administration | 10% | 9% | 8% | 11% | 6% |
| Total ($ millions) | $6.2 | $4.3 | $27.1 | $6.2 | $864 |
| Source: Wyoming Economic Analysis Division 2009a | |||||
Together, the data on sales tax collections and that on property tax valuations by sector provide insight into the economic base of the counties. Retail trade contributes the largest share of sales tax revenues in all four counties. Large shares are also contributed by several other sectors: wholesale trade, utilities, mining, leisure and hospitality, and public administration. Mineral and mining-related property provides the most important contributor to state and local assessed valuation for property taxes, with residential property the second most important contributor.
Separate data on sales tax revenues from retail trade, accommodation, and food sales (Table 3-81) provide some additional insight into the contribution from elements related to travel and tourism, specifically: eating and drinking places and lodging. (A portion of tax collections from eating and drinking places also accrue from local residents, and a portion of gasoline station tax collections would also accrue from tourists and business travelers.) These data suggest that travel and tourism provide an important contribution to sales tax collections in the Planning Area counties.
Dean Runyan Associates, working for the Wyoming Office of Travel and Tourism, estimated that statewide in 2009, travel and tourism from business and recreational visitors accounted for $65 million in state sales, use, and lodging tax revenues and $42 million in local sales, use, and lodging tax revenues, not including property tax collections related to recreation infrastructure (DRA 2010). This estimate is based on the data above, as well as additional survey data from a variety of sources. Table 3-82 shows tax receipts due to travel and tourism for the counties in the Planning Area. Local taxes include room taxes, local sales taxes, and the local share of state taxes. State taxes include the state share of the sales tax and the state motor fuel tax (DRA 2010).
Table 3.81. Retail, Accommodation, and Food Sales:State and Local Sales Tax Collections, 2009
| Sector | Big Horn County | Hot Springs County | Park County | Washakie County | state of Wyoming |
|---|---|---|---|---|---|
| Auto Dealers and Parts | 9% | 3% | 4% | 11% | 7% |
| Building Material and Garden Supplies | 23% | 28% | 14% | 21% | 16% |
| Clothing and Shoe Stores | 0.6% | 0.6% | 3% | 2% | 3% |
| Department Stores | 0.8% | 0.4% | 2% | 0.5% | 3% |
| Eating and Drinking Places | 11% | 17% | 15% | 13% | 14% |
| Electronic and Appliance Stores | 4% | 2% | 3% | 5% | 5% |
| Gasoline Stations | 17% | 5% | 3% | 3% | 7% |
| General Merchandise Stores | 3% | 8% | 16% | 11% | 15% |
| Grocery and Food Stores | 10% | 5% | 5% | 7% | 3% |
| Home Furniture and Furnishings | 2% | 0.7% | 2% | 3% | 2% |
| Liquor Stores | 1% | 0.9% | 2% | 1% | 2% |
| Lodging Services | 4% | 13% | 13% | 4% | 8% |
| Miscellaneous Retail | 14% | 16% | 18% | 19% | 16% |
| Total ($ millions) | $2.4 | $2.0 | $16.0 | $3.0 | $362 |
| Source: Wyoming Economic Analysis Division 2009a | |||||
Table 3.82. Local and State Tax Receipts Due to Travel and Tourism in Wyoming, 2009 ($ millions)
| Locality | Local Tax Receipts | State Tax Receipts |
| Big Horn County | $0.3 | $0.8 |
| Hot Springs | $0.4 | $0.7 |
| Park County | $3.3 | $5.3 |
| Washakie County | $0.2 | $0.5 |
| state of Wyoming | $42 | $65 |
| Source: DRA 2010 | ||
Table 3-83 provides trends of local and state tax receipts due to travel and tourism for the Planning Area counties from 2003 through 2009. Note that the data in the table are in current dollars, that is, are not adjusted for inflation. The table shows that local and state tax receipts rose steadily but slowly between 2003 and 2008 for all four Planning Area counties and for the state, then dipped slightly in 2009 for the state (but generally remained stable in the four Planning Area counties). Among the four counties, tax receipts are consistently highest in Park County.
Table 3.83. Local and State Tax Receipts Due to Travel and Tourism, 2003-2009 ($ millions)
| County | 2003 | 2004 | 2005 | 2006 | 2007 | 2008 | 2009 |
|---|---|---|---|---|---|---|---|
| Local Tax Receipts | |||||||
| Big Horn | $0.2 | $0.2 | $0.2 | $0.3 | $0.3 | $0.3 | $0.3 |
| Hot Springs | $0.3 | $0.3 | $0.4 | $0.4 | $0.4 | $0.5 | $0.4 |
| Park | $2.4 | $2.4 | $2.7 | $2.7 | $3.1 | $3.3 | $3.3 |
| Washakie | $0.1 | $0.1 | $0.1 | $0.1 | $0.2 | $0.2 | $0.2 |
| Wyoming | $31 | $31 | $36 | $40 | $43 | $44 | $42 |
| State Tax Receipts | |||||||
| Big Horn | $0.6 | $0.6 | $0.7 | $0.7 | $0.8 | $0.8 | $0.8 |
| Hot Springs | $0.5 | $0.5 | $0.6 | $0.6 | $0.7 | $0.7 | $0.7 |
| Park | $4.2 | $4.2 | $4.5 | $4.4 | $5.0 | $5.3 | $5.3 |
| Washakie | $0.5 | $0.4 | $0.5 | $0.6 | $0.6 | $0.5 | $0.5 |
| Wyoming | $51 | $52 | $56 | $61 | $64 | $69 | $65 |
| Source: DRA 2010. Note: Data are in current dollars (i.e., are not adjusted for inflation). | |||||||
