This section describes the climate and existing air quality in the region that the four alternatives described in Chapter 2 could affect. Air pollutants addressed include criteria pollutants, hazardous air pollutants (HAPs), and sulfur and nitrogen compounds that could impair visibility or cause atmospheric deposition, including acid rain.
Air Quality Indicators
The air pollutants addressed in this section include criteria air pollutants, HAPs, and sulfur and nitrogen compounds. State and National Ambient Air Quality Standards (NAAQS) set the maximum thresholds for criteria air pollutants. The Wyoming Prevention of Significant Deterioration (PSD) program establishes allowable increases of a given pollutant for a particular area from specific sources.
Criteria Air Pollutants
The U.S. Environmental Protection Agency (EPA) established air quality standards (NAAQS) for criteria pollutants. Criteria pollutants include carbon monoxide (CO), nitrogen dioxide (NO2), ozone (O3), particulate matter (PM10 and PM2.5), sulfur dioxide (SO2), and lead (Pb). Air-pollutant concentrations greater than the NAAQS represent a risk to human health.
Hazardous Air Pollutants
There are a wide variety of HAPs, including benzene, toluene, ethylbenzene, xylene (also referred to as BETEX), N-hexane, and formaldehyde. There are no federal air quality standards for HAPs (there are exposure thresholds), but some states have established “significance thresholds” to evaluate human exposure for potential chronic inhalation illness and cancer risks.
Wyoming and National Ambient Air Quality Standards
Wyoming Ambient Air Quality Standards (WAAQS) and NAAQS identify maximum limits for concentrations of criteria air pollutants at all locations to which the public has access. The WAAQS and NAAQS are legally enforceable standards. Concentrations above the WAAQS and NAAQS represent a risk to human health that, by law, require public safeguards be implemented. State standards must be at least as protective of human health as federal standards, and may be more restrictive than federal standards, as allowed by the Clean Air Act.
Visibility
Visibility, also referred to as visual range, is a subjective measure of the distance that light or an object can clearly be seen by an observer. Light extinction is used as a measure of visibility and is calculated from the monitored components of fine particle mass (aerosols) and relative humidity. It is expressed in terms of deciviews, a measure for describing perceived changes in visibility. One deciview is defined as a change in visibility that is just perceptible to an average person, which is approximately a 10-percent change in light extinction. To estimate potential visibility impairment, monitored aerosol concentrations are used to reconstruct visibility conditions for each day monitored. The aerosol species include ammonium sulfate, ammonium nitrate, organic mass, elemental carbon, soil elements, and coarse mass. The daily values are then ranked from clearest to haziest and divided into three categories to indicate the mean visibility for all days (average), the 20 percent of days with the clearest visibility (20 percent clearest), and the 20 percent of days with the worst visibility (20 percent haziest). Visibility can also be defined by standard visual range (SVR) measured in miles, which is the farthest distance at which an observer can see a black object viewed against the sky above the horizon; the larger the SVR, the cleaner the air.
Since 1980, the Interagency Monitoring of Protected Visual Environments (IMPROVE) network has measured visibility in national parks and wilderness areas. These are managed as high visual quality Class I and II areas under the federal visual resource management (VRM) program. There are six IMPROVE stations in Wyoming, including one in the Planning Area at the North Absaroka site and two adjacent to the Planning Area (in the BLM Buffalo Field Office planning area) at the Thunder Basin National Grasslands and Cloud Peak National Wilderness areas.
Atmospheric Deposition
Atmospheric deposition refers to processes in which air pollutants are removed from the atmosphere and deposited into terrestrial and aquatic ecosystems. Air pollutants can be deposited by precipitation (rain and snow) or the gravitational settling of gaseous pollutants on soil, water, and vegetation. Much of the concern about deposition is due to secondary formation of acids and other compounds from emitted nitrogen and sulfur species, such as oxides of nitrogen (NOx) and SO2, which can contribute to acidification of lakes, streams, and soils and affect other ecosystem characteristics, including nutrient cycling and biological diversity.
Substances deposited include:
• Acids, such as sulfuric (H2SO4) and nitric (HNO3), sometimes referred to as acid rain.
• Air toxics, such as pesticides, herbicides, and volatile organic compounds (VOC).
• Heavy metals, such as mercury.
• Nutrients, such as nitrates (NO3-) and ammonium (NH4+).
The accurate measurement of atmospheric deposition is complicated by contributions to deposition by several components rain, snow, cloud water, particle settling, and gaseous pollutants. Deposition varies with precipitation and other meteorological variables (e.g., temperature, humidity, winds, and atmospheric stability), which in turn, vary with elevation and time.
The USFS has established guidelines or Levels of Concern (LOC) for total deposition of nitrogen and sulfur compounds in Class I Wilderness Areas (USFS 2007a). Total nitrogen deposition of 1.5 kilograms (kg) per hectare (ha) per year or less is considered to be unlikely to harm terrestrial or aquatic ecosystems. For total sulfur deposition, the LOC is 5 kg per ha per year. The USFS is considering a sulfur LOC of 1.5 kg per ha per year. Note that these are the same LOCs the National Park Service uses.
Monitoring of Air Quality, Visibility, and Deposition in the Planning Area
Although various state and federal agencies monitor air pollutant concentrations, visibility, and atmospheric deposition throughout Wyoming, at present there are only two air quality monitors in the Planning Area (in Cody and the North Absaroka area). Table 3–1 lists the available air quality monitoring sites in the Bighorn Basin and relevant sites nearby. The Wyoming Department of Environmental Quality (DEQ) operates a PM10 monitor as part of the State and Local Air Monitoring Site (SLAMS) network in Cody, Wyoming (Park County). Additional SLAMS and Special Purpose Monitoring (SPM) sites operate in nearby counties. Nearby monitoring sites include several IMPROVE monitors and BLM-administered sites that are part of the Wyoming Air Resource Monitoring System (WARMS). Atmospheric deposition (wet) measurements of NH4, sulfate (SO4), and various metals are taken at the Sinks Canyon, Pinedale, and Newcastle sites, which the BLM operates as part of the National Atmospheric Deposition Program (NADP), as well as South Pass and Yellowstone Park sites.
Table 3.1. Air Quality Monitoring Sites or Near the Planning Area
| County | Site Name | Type of Monitor | Parameter | Operating Schedule | Location | |
|---|---|---|---|---|---|---|
| Longitude | Latitude | |||||
| Park | Cody | SLAMS | PM10 | 1/6 | -109.073 | 44.532 |
| North Absaroka (managed by USFS) | IMPROVE | PM2.5, NO3-, Ammonium, Nitric Acid, Sulfate, Sulfur Dioxide & Meteorology | 1/3 | -109.382 | 44.745 | |
| Fremont | Lander | SLAMS | PM2.5 | 1/3 | -108.733 | 42.833 |
| Campbell | Thunder Basin | SPM | Ozone, Nitrogen Oxides & Met | Hourly | -105.300 | 44.672 |
| Thunder Basin | IMPROVE | PM2.5, NO3-, Ammonium, Nitric Acid, Sulfate, Sulfur Dioxide & Meteorology | 1/3 | -105.287 | 44.663 | |
| Johnson | Buffalo | WARMS | PM2.5, NO3-, Ammonium, Nitric Acid, Sulfate, Sulfur Dioxide & Meteorology | 1/3 (PM2.5) & 1/7 (others) | -106.019 | 44.144 |
| Cloud Peak | IMPROVE | PM2.5, NO3-, Ammonium, Nitric Acid, Sulfate, Sulfur Dioxide & Meteorology | 1/3 | -106.956 | 44.333 | |
| Sheridan | Sheridan - Highland Park | SLAMS | PM10 & PM2.5 | 1/3 (PM10); 1/3 & 1/6 (PM2.5) | -107.000 | 44.806 |
| Sheridan - Police Station | SLAMS | PM10 & PM2.5 | 1/1 (PM10) & 1/3 & 1/6 (PM2.5) | -107.000 | 44.833 | |
| Sheridan (managed by BLM) | WARMS | PM2.5, NO3-, Ammonium, Nitric Acid, Sulfate & Sulfur Dioxide | 1/3 (PM2.5) & 1/7 (others) | -106.847 | 44.933 | |
| Source: WARMS 2010; EPA 2010a; IMPROVE 2010; Wyoming DEQ 2010; Wyoming DEQ 2010; NADP 2010 | ||||||
| BLM | Bureau of Land Management |
| IMPROVE | Interagency Monitoring of Protected Visual Environments |
| NO3- | Nitrate |
| PM | Particulate Matter |
| SLAMS | State and Local Air Monitoring Site |
| SPM | Special Purpose Monitoring |
| USFS | United States Forest Service |
| WARMS | Wyoming Air Resource Monitoring System |
Current Conditions
Climate
The climate in the Planning Area is designated as a combination of Intermountain Semi-desert and Southern Rocky Mountain Steppe. The Bighorn Basin is bounded on the northeast by the Pryor Mountains, on the east by the Big Horn Mountains, on the south by Owl Creek and Bridger and Washakie Ranges, on the west by the Absaroka Mountains, and open to the north into Montana. Summers are generally hot and short, and winters long and cold. Precipitation is generally low, though greater at higher elevations, and is generally evenly distributed across the year, with the exception of the drier summer months. Wind speeds are variable and generally strong. Table 3–2 lists temperature, precipitation, and wind speed data for the Planning Area. This information is derived from daily ambient measurements for 1971 through 2000. The summer period covers June, July, and August; the winter period covers December, January, and February. Based on these limited data, meteorological conditions vary somewhat across the Planning Area, with the Worland area in the middle of the Planning Area showing higher mean maximum summer temperatures, lower mean winter temperatures, and overall drier conditions compared to Cody, which is in the western part of the Planning Area.
Table 3.2. Temperature, Precipitation, and Wind Speed Data for the Planning Area
| Climate Component | Cody, Wyoming | Worland, Wyoming |
|---|---|---|
| Mean maximum summer temperatures (June, July, and August) (degrees Fahrenheit) | 75.6, 82.9, 81.4 | 81.3, 89.8, 88.6 |
| Mean minimum winter temperatures (December, January, and February) (degrees Fahrenheit) | 16.7, 14.5, 18.9 | 6.0, 2.4, 9.9 |
| Mean annual temperature (degrees Fahrenheit) | 46.2 | 44.9 |
| Mean annual precipitation (inches) | 9.95 | 8.03 |
| Mean annual snowfall (inches) | 39.7 | 16.0 |
| Mean annual wind speed (miles per hour) | 7.7 | 5.6 |
| Prevailing wind direction | Northerly/westerly | Northerly/southerly |
| Sources: Western Regional Climate Center; Bailey 1995 | ||
In the Planning Area, the potential effects of climate change on air quality are likely to be varied. For example, if global climate change results in a warmer and drier climate, this could result in increased concentrations of PM due to increased windblown dust from drier and less stable soils. Less snow and an earlier snowmelt could result in a longer wildland fire season, which could lead to higher concentrations of ozone and PM.
Some activities within the Planning Area generate greenhouse gas (GHG) emissions. Oil and gas development activities can generate carbon dioxide (CO2) and methane (CH4). CO2 emissions result from the use of combustion engines, while CH4 can be released during processing. Wildland fires also are a source of CO2 and other GHG emissions, while livestock grazing is a source of CH4. Other activities in the Planning Area with the potential to contribute to climate change include soil erosion from disturbed areas and fugitive dust from roads, which have the potential to darken snow-covered surfaces and cause faster snow melt.
Please see the last section of this chapter for a further discussion of climate change.
Air Quality
With only two air quality monitors in the Planning Area (Cody/PM10 and North Absaroka/IMPROVE), it is difficult to accurately assess existing air quality conditions throughout the area. However, as noted above, air quality, visibility, and atmospheric deposition are monitored throughout Wyoming, including adjacent planning areas. Therefore, the BLM assessed recent air quality conditions in the Bighorn Basin by examining data collected at the two monitors in the area, supplemented by various monitors in neighboring planning areas, as summarized in Table 3–1. The examination of these data indicates that the current air quality for criteria pollutants in the Planning Area is considered good overall. Based on measurements in the area, visibility in the Planning Area is considered excellent.
Table 3–3 is an overview of the applicable primary WAAQS and NAAQS and recent representative maximum pollutant concentrations measured in and at sites near the Planning Area. These representative concentrations can be compared with the applicable WAAQS and NAAQS to indicate the status of recent air quality conditions within the Planning Area relative to the standards.
Trends
This section describes recent trends in air quality in the Planning Area by examining data collected at the Cody PM10 monitor and North Absaroka IMPROVE site, and as best as can be inferred criteria-pollutant, visibility, and deposition data collected at monitoring sites outside the Bighorn Basin in adjacent areas.
Air Pollutant Concentrations
This section presents air quality data collected at the various monitors in and near the Planning Area (see Table 3–1) for PM10, PM2.5, SO2, and O3. Figure 3–1 shows annual peak 24-hour average PM10 concentrations at the Cody site for 2000 through 2009. Over this period, peak 24-hour average measurements of PM10 were well below the NAAQS (150 micrograms per cubic meter [µg/m3]) and vary considerably from year to year, but apart from a slight upward trend during the last 4 years, there is no real discernable trend during this period.
Table 3.3. Applicable National and State Primary Air Quality Standards for Criteria Pollutants and Current Representative Concentrations for the Planning Area
| Pollutant | Averaging Time | NAAQS | WAAQS | Representative Concentrations | ||||||
|---|---|---|---|---|---|---|---|---|---|---|
| (ppm) | (ppb) | (µg/m3) | (ppm) | (ppb) | (µg/m3) | (ppm) | (ppb) | (µg/m3) | ||
| Carbon Monoxide | 1 hour[a] | 35 | 35,000 | 40,000 | 35 | 35,000 | 40,000 | 1.7 | 1,730 | 1,979 |
| 8 hour[a] | 9 | 9,000 | 10,000 | 9 | 9,000 | 10,000 | 0.8 | 814 | 931 | |
| Nitrogen Dioxide | 1 hour[b] | 0.10 | 100 | 188.7 | N/A | N/A | N/A | 0.014 | 14 | 26.4 |
| Annual [c](Arithmetic Mean) | 0.053 | 53 | 100 | 0.053 | 53 | 100 | 0.00168 | 1.68 | 2.9 | |
| Ozone | 8 hour[d] | 0.075 | 75 | 147 | 0.075 | 75 | 147 | 0.062 | 62 | 121 |
| PM10 | 24 hour[e] | N/A | N/A | 150 | N/A | N/A | 150 | N/A | N/A | 78 |
| Annual[f] | N/A | N/A | N/A | N/A | N/A | 50 | N/A | N/A | 11 | |
| PM2.5 | 24 hour[g] | N/A | N/A | 35 | N/A | N/A | 65 | N/A | N/A | 5.0 |
| Annual[h] | N/A | N/A | 15 | N/A | N/A | 15 | N/A | N/A | 1.8 | |
| Sulfur Dioxide | 1 hour[i] | 0.075 | 75 | 195 | N/A | N/A | N/A | Missing | Missing | Missing |
| 3 hour | N/A | N/A | N/A | 0.5 | 500 | 1,300 | Missing | Missing | Missing | |
| 24 hour [j] | 0.140 | 140 | 365 | 0.099 | 99 | 260 | 0.00045 | 0.45 | 1.19 | |
| Annual [k] (Arithmetic Mean) | 0.031 | 31 | 80 | 0.023 | 23 | 60 | 0.00018 | 0.18 | 0.48 | |
[a] Not to be exceeded more than once per year. Data collected at Yellowstone National Park during 2005. [b] To attain this standard, the 3-year average of the 98th percentile of 1-hour concentrations at each monitor within an area must not exceed 100 ppb. Thunder Basin data, 2009. [c] Thunder Basin annual average for 2009. [d] To attain this standard, the 3-year average of the fourth-highest daily maximum 8-hour average ozone concentrations measured at each monitor within an area over each year must not exceed 75 ppb. Measured fourth highest concentration for 2009 for the Thunder Basin site. [e] Not to be exceeded more than once per year on average over 3 years. Maximum 24-hour average for 2009 at Cody SLAMS site. [f] Annual average for 2009 for Cody SLAMS site. [g] To attain this standard, the 3-year average of the 98th percentile of 24-hour concentrations at each population-oriented monitor in an area must not exceed 35 µg/m3. Maximum 24-hour average for 2009 for the North Absaroka IMPROVE site. [h] To attain this standard, the 3-year average of the weighted annual mean PM2.5 concentrations from single or multiple community-oriented monitors must not exceed 15.0 µg/m3. Annual average for 2009 for the North Absaroka site. [i] To attain this standard, the 3-year average of the 98th percentile of 1-hour concentrations at each monitor within an area must not exceed 100 ppb. [j] Not to be exceeded more than once per year. Maximum 24-hour average for 2009 for the Sheridan WARMS site. [k] Maximum annual average for 2009 for the Sheridan WARMS site. | ||||||||||
| µg/m3 micrograms per cubic meter | PM2.5 particulate matter less than 2.5 microns in diameter |
| N/A Not Applicable | PM10 particulate matter less than 10 microns in diameter |
| NAAQS National Ambient Air Quality Standards | SLAMS State and Local Air Monitoring Site |
| ppb parts per billion | WAAQS Wyoming Ambient Air Quality Standards |
| ppm parts per million | WARMS Wyoming Air Resource Monitoring System |
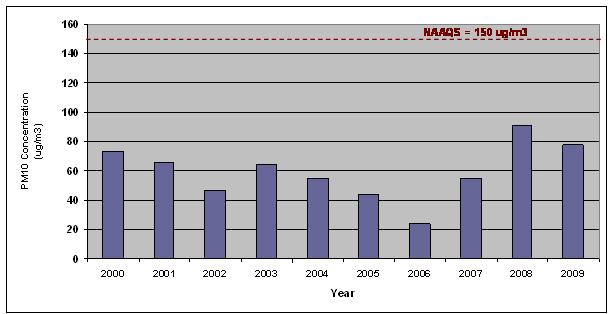
Source: EPA 2010
Note: The National Ambient Air Quality Standard for 24-hour average PM10 concentrations is 150 µg/m3.
Figure 3.1. Peak 24-Hour Average Particulate Matter (PM10) Concentrations (µg/m3) in Cody, Wyoming
| NAAQS | National Ambient Air Quality Standards |
| µg/m3 | micrograms per cubic meter |
| PM10 | particulate matter less than 10 microns in diameter |
Figure 3–2 shows peak 24-hour average PM2.5 data collected at the North Absaroka monitor for 2002 through 2009. The data indicate that the peak 24-hour average PM2.5 concentration in the North Absaroka area was well below the NAAQS with no discernable trend during this period (IMPROVE 2010).
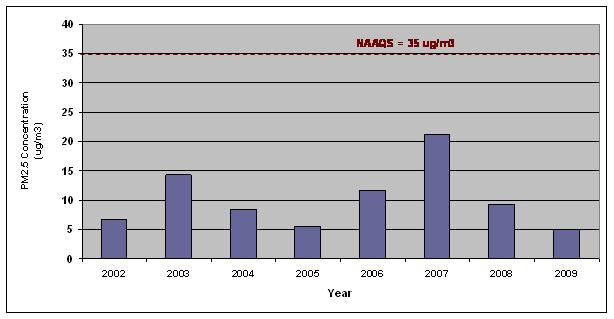
Source: IMPROVE 2010
Note: The National Ambient Air Quality Standard for 24-hour average PM2.5 concentrations is 35 µg/m3.
Figure 3.2. Peak 24-Hour Average Particulate Matter (PM2.5) Concentrations (µg/m3) for the North Absaroka Site
| NAAQS | National Ambient Air Quality Standards |
| µg/m3 | micrograms per cubic meter |
| PM10 | particulate matter less than 2.5 microns in diameter |
In addition to measurements collected in the Planning Area at North Absaroka, the BLM also examined data collected in an area to the south near Lander, Wyoming. Figure 3–3 shows annual average PM2.5 data collected at the Lander monitor for 2000 through 2009. The data indicate that annual average PM2.5 concentrations in the Lander area are higher than those measured at North Absaroka, but are still well below the NAAQS. Trends are relatively flat during the last 5 years.
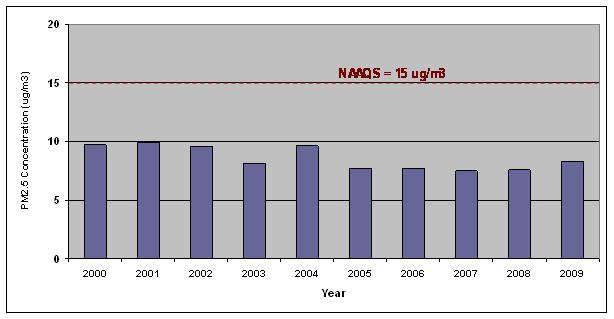
Source: EPA 2010
Note: The National Ambient Air Quality Standard for annual average PM2.5 concentrations is 15 µg/m3.
Figure 3.3. Annual Average Particulate Matter (PM2.5) Concentrations (µg/m3) for the Lander Site
| NAAQS | National Ambient Air Quality Standards |
| µg/m3 | micrograms per cubic meter |
| PM10 | particulate matter less than 2.5 microns in diameter |
Figure 3-4 lists 24-hour average PM2.5 data collected at the Lander monitor for 2000 through 2009. The data indicate that for 2000 through 2005, the peak 24-hour average PM2.5 concentration in the Lander area was at or above the NAAQS, with a maximum concentration in 2001 of 55 µg/m3, which is almost 60 percent higher than the national standard. Measurements for the 4 most recent years are lower and vary from year to year, with a value of 37.8 µg/m3 in 2009 that exceeds the national standard.
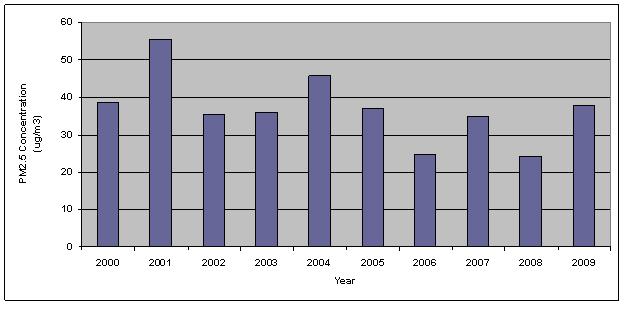
Source: EPA 2010
Note: The National Ambient Air Quality Standard for 24-hour average PM2.5 concentrations is 35 µg/m3.
Figure 3.4. Peak 24-Hour Average Particulate Matter (PM2.5) Concentrations (µg/m3) for the Lander Site
| NAAQS | National Ambient Air Quality Standards |
| µg/m3 | micrograms per cubic meter |
| PM10 | particulate matter less than 2.5 microns in diameter |
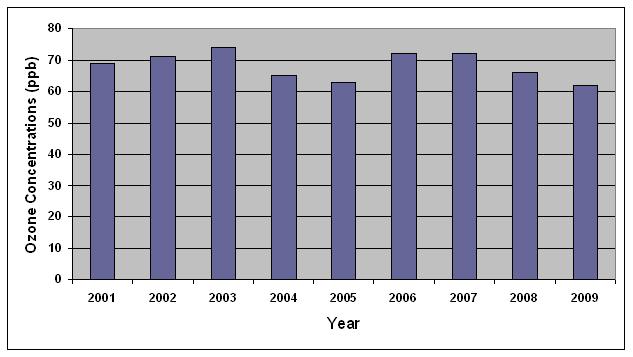
Figure 3-5 lists the fourth highest 8-hour average ozone data for the Thunder Basin site for 2001 through 2009. These data are used to determine the area’s ozone “design value,” which is calculated as the 3-year average of the fourth highest observed concentration. The design value is used to assess compliance with the standard. The most recent design value for the Thunder Basin site for 2007 through 2009 is 66 parts per billion (ppb), which is below the current 8-hour ozone NAAQS of 75 ppb. (Currently EPA is evaluating the level of the standard and may reduce this value to 70 ppb or lower. If the 8-hour ozone NAAQS is reduced to 70 ppb, it is possible that areas with design values greater than the new standard (e.g., those located in the adjacent Buffalo and other planning areas in Wyoming) would be designated ozone nonattainment areas. Although a new WARMS monitoring site began operating northwest of Worland in March 2010, there are currently no ozone monitors in the Planning Area with three complete years of data that are required to calculate a design value that is used to determine attainment of the standard.) Although the data vary from year to year during this period, there is no discernable trend in the fourth highest 8-hour ozone concentrations at this site. However, as noted above for the Sheridan site, the Thunder Basin site also is in the adjacent Buffalo Field Office area on the other side of the Big Horn Mountain range and might not be representative of ozone air quality in the Bighorn Basin. This could be due to the influence of local sources of precursor emissions and terrain on secondary ozone production and transport in and throughout the Bighorn Basin. The local sources influencing ozone production in the Bighorn Basin are different from those in the Buffalo Field Office and the 8-hour ozone design value for the Bighorn Basin might be quite different.
Source: Wyoming DEQ 2010
Note: The National Ambient Air Quality Standard for 8-hour average ozone concentrations is 75 ppb.
Figure 3.5. Fourth Highest 8-Hour Average Ozone for the Thunder Basin Special Purpose Monitoring Site
| ppb | parts per billion |
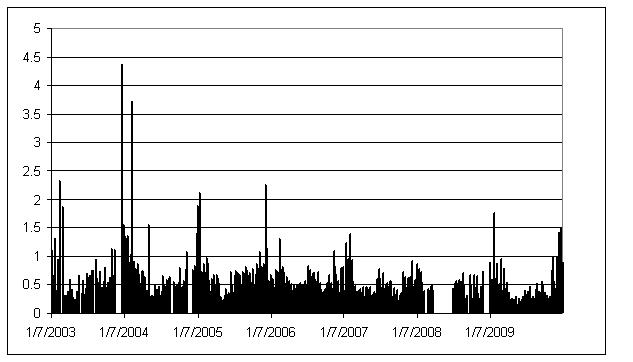
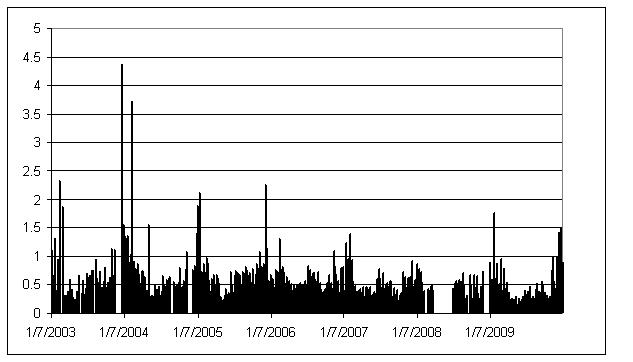
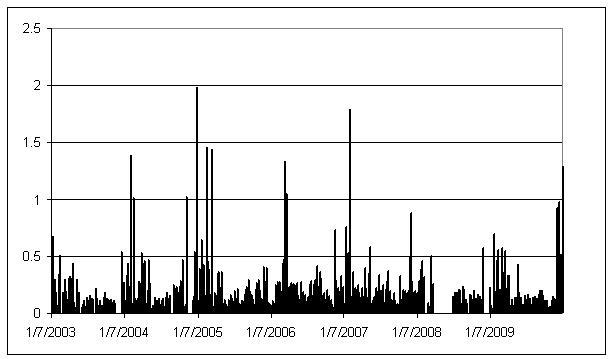
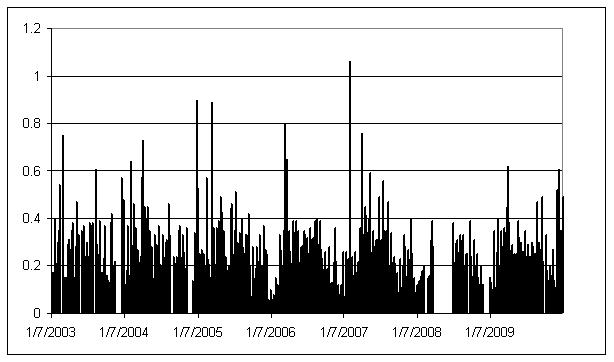
Although not in the Planning Area, monitoring sites at the nearby Buffalo and Sheridan sites as part of the WARMS network provide a summary of observed concentrations of sulfur and nitrogen compounds. Figures 3-6, 3-7, 3-8, and 3-9 show weekly average concentrations of SO2, SO4, NO3, and NH4 respectively, for the Buffalo site for 2003 through 2009. There are data missing for a number of weeks throughout this period, especially in 2008. The data show weekly and seasonal variations in these compounds, with no real discernable long-term trends over the period.
Source: WARMS 2010
| µg/m3 | micrograms per cubic meter |
| SO2 | sulfur dioxide |
| WARMS | Wyoming Air Resource Monitoring System |
Source: WARMS 2010
| µg/m3 | micrograms per cubic meter |
| SO4 | sulfate |
| WARMS | Wyoming Air Resource Monitoring System |
Source: WARMS 2010
| µg/m3 | micrograms per cubic meter |
| NO2 | nitrate |
| WARMS | Wyoming Air Resource Monitoring System |
Source: WARMS 2010
| µg/m3 | micrograms per cubic meter |
| NH4 | ammonium |
| WARMS | Wyoming Air Resource Monitoring System |
Visibility
There are several National Parks, National Forests, recreation areas, and wilderness areas in or near the Planning Area. Table 3-4 lists areas designated as Class I or Class II.
Table 3.4. Class I and Class II Areas In or Near the Planning Area
| Area Type | Area Name | Closest Distance to the Planning Area (miles) | Direction from the Planning Area | Clean Air Act Status of the Area |
| National Park | Wind Cave National Park | 200 | East | Class I |
| Yellowstone National Park | Adjacent | West | Class I | |
| Recreation Area | Bighorn Canyon National Recreation Area | In | Class II | |
| Wilderness Area | Cloud Peak Wilderness Area | In | Class II | |
| North Absaroka Wilderness Area | In | Class I | ||
| Washakie Wilderness Area | In | Class I | ||
| Fitzpatrick Wilderness Area | 30 | Southwest | Class I | |
| Popo Agie Wilderness Area | 50 | South | Class II | |
| Bridger Wilderness Area | 35 | Southwest | Class I | |
| Teton Wilderness Area | Adjacent | Southeast | Class II | |
| National Forest | Bighorn National Forest | In | Class II | |
| Thunder Basin National Grassland | 75 | East | Class II | |
| Source: NPS 2006 | ||||
As noted above, estimates of visibility in the Planning Area are primarily derived from air quality and meteorological measurements taken at the North Absaroka IMPROVE site. To supplement these measurements, the BLM used recent data collected at the nearby Cloud Peak IMPROVE monitor to assess regional visibility conditions.
Figure 3–10 shows visibility estimates for the North Absaroka site for 2002 through 2008. Although missing for 2007 the data indicate excellent visibility conditions, with no real trends in this limited period. Figure 3–11shows visibility data for the Cloud Peak IMPROVE site for 2003 through 2008. The data for the Cloud Peak site are quite consistent with the North Absaroka site, reflecting excellent visibility conditions.
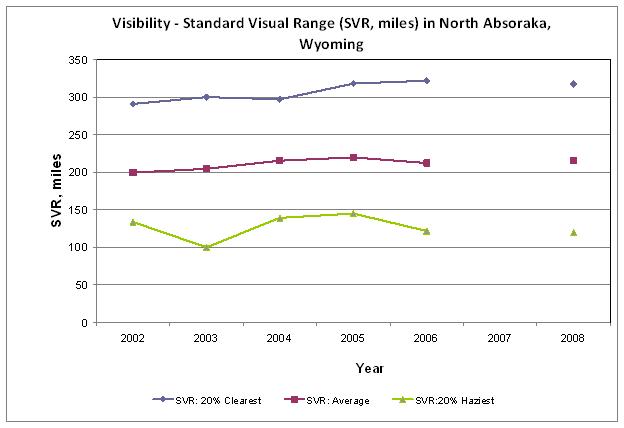
Figure 3.10. Visibility — Standard Visual Range (SVR, miles) — for the North Absaroka, Wyoming IMPROVE Site
Source: IMPROVE 2010
| IMPROVE | Interagency Monitoring of Protected Visual Environments |
| SVR | standard visual range |
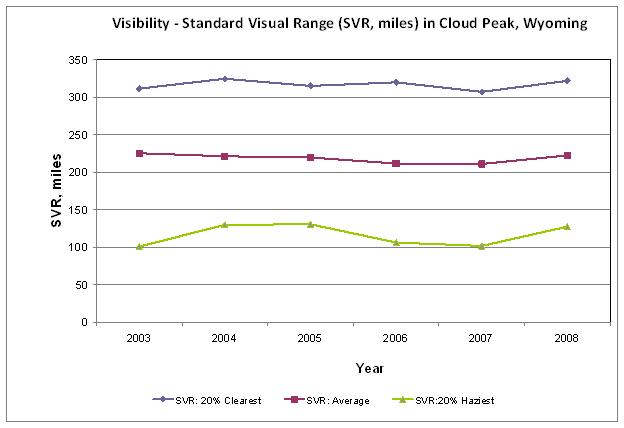
Figure 3.11. Visibility – Standard Visual Range (SVR, miles) for the Cloud Peak, Wyoming IMPROVE Site
Source: IMPROVE 2010
| IMPROVE | Interagency Monitoring of Protected Visual Environments |
| SVR | standard visual range |
Atmospheric Deposition
There are no NADP or Clean Air Status and Trends Network (CASTNet)/Water and Atmospheric Resource Monitoring (WARM) stations in the Planning Area, but wet deposition measurements are available for the nearby Yellowstone, Sinks Canyon, and South Pass City NADP monitors. Figure 3-12 shows total annual wet deposition for NH4, NO3, and SO4 for 2000 through 2009 for Yellowstone. Figures 3-13 and 3-14 show similar wet deposition information for the Sinks Canyon and South Pass sites, respectively. There are no discernable trends in these measurements over this period.
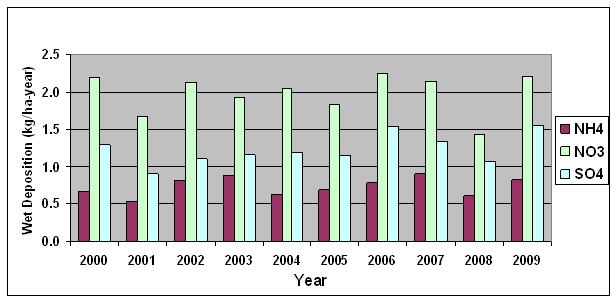
Figure 3.12. Total Annual Wet Deposition (kilograms per hectare per year) Yellowstone Park, Wyoming NADP Site
Source: NADP2010
| NADP | National Acid Deposition Program |
| NH4 | ammonium |
| NO3 | nitrate |
| SO4 | sulfate |
| kg | kilogram |
| ha | hectare |
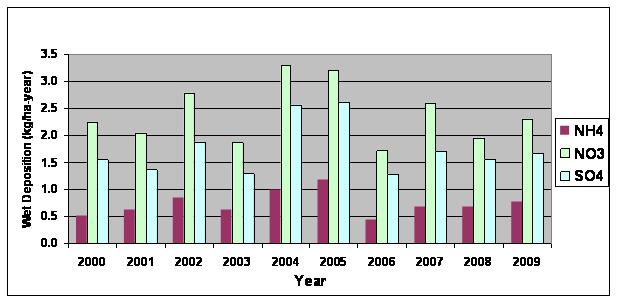
Figure 3.13. Total Annual Wet Deposition (kilograms per hectare per year) Sinks Canyon, Wyoming NADP Site
Source: NADP2010
| NADP | National Acid Deposition Program |
| NH4 | ammonium |
| NO3 | nitrate |
| SO4 | sulfate |
| kg | kilogram |
| ha | hectare |
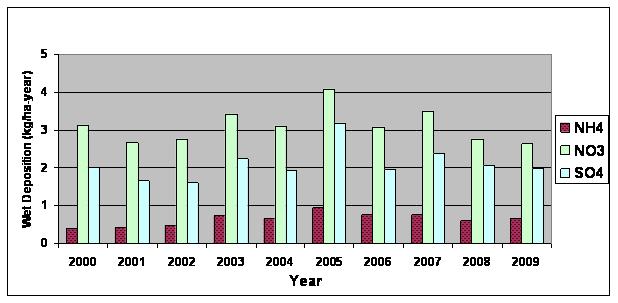
Figure 3.14. Total Annual Wet Deposition (kilograms per hectare per year) South Pass City, Wyoming NADP Site
Source: NADP2010
| NADP | National Acid Deposition Program |
| NH4 | ammonium |
| NO3 | nitrate |
| SO4 | sulfate |
| kg | kilogram |
| ha | hectare |
Hazardous Air Pollutants, Criteria Pollutants, and Greenhouse Gas
Existing sources of HAPs, criteria pollutants, and GHGs in the Planning Area include fossil fuel combustion that emits HAPs; oil, gas, and coal development operations that emit VOCs; NOX; and hydrogen sulfide (H2S). In addition, large fires are a source of HAPs emissions. The growth in resource development and accompanying increase in emissions from these types of sources will depend on a number of external factors that make it difficult to estimate actual trends in these pollutants.
Available air quality data for a number of criteria pollutants that were examined at various monitors in and near the Planning Area do not show any major upward or downward trends over the various periods of record. There is a slight upward trend in observed PM10 concentrations at the Cody site during the last three years, but no real discernable trend over the longer period of record. Concentrations of PM2.5 at the North Absaroka site are very low, vary from year to year, and do not show any discernable trend over the 8-year period examined. PM2.5 data for the Lander site show a relatively flat trend during the last 4 years of record (2006 through 2009). For the Sheridan site, the fourth highest 8-hour average ozone concentrations are consistent year to year, without any discernable trends. Although trends were not explicitly calculated for SO2, SO4, NO3, and NH4, the data do not indicate any major trends for the 6-year period examined at the Buffalo site, which is adjacent to the Bighorn Basin. The visibility data collected at the North Absaroka and Cloud Peak sites show very good to excellent visibility, even for the 20 percent haziest days, with a very slight degradation observed at the Cloud Peak monitor during the 5-year period of record. Wet-deposition data for NH4, NO3, and SO4 for the Yellowstone, Sinks Canyon, and South Pass City sites also show no distinct trend in deposition over the 10-year period of record (2000 through 2009) examined in this analysis.
Management Challenges
Due to limited data, accurately characterizing air quality in the Planning Area is a challenge. However, limited monitoring at two sites in the Planning Area and data collected at monitors in adjacent areas do reflect good to excellent air quality and visibility conditions. Continued maintenance of the federal and state air quality standards could be an issue without a complete understanding of existing air quality. As additional resource development scenarios are considered for the area, it will be important to evaluate the effects that emissions from development sources would have on criteria pollutants, visibility, and atmospheric deposition levels. The BLM will work cooperatively with the Wyoming DEQ and the EPA and other federal agencies to address these issues.
Other management challenges include identifying the full spectrum of air quality issues in the Bighorn Basin and developing effective management actions aimed at maintaining compliance with standards and improving air quality.
