The analysis of economic impacts considers only recreation expenditures of nonresidents of the Planning Area. This is based on the assumption that expenditures of residents would occur in the region regardless of the BLM’s actions that impact recreational opportunities; however, changes in nonresident recreation patterns would alter the amount of money entering the local region.
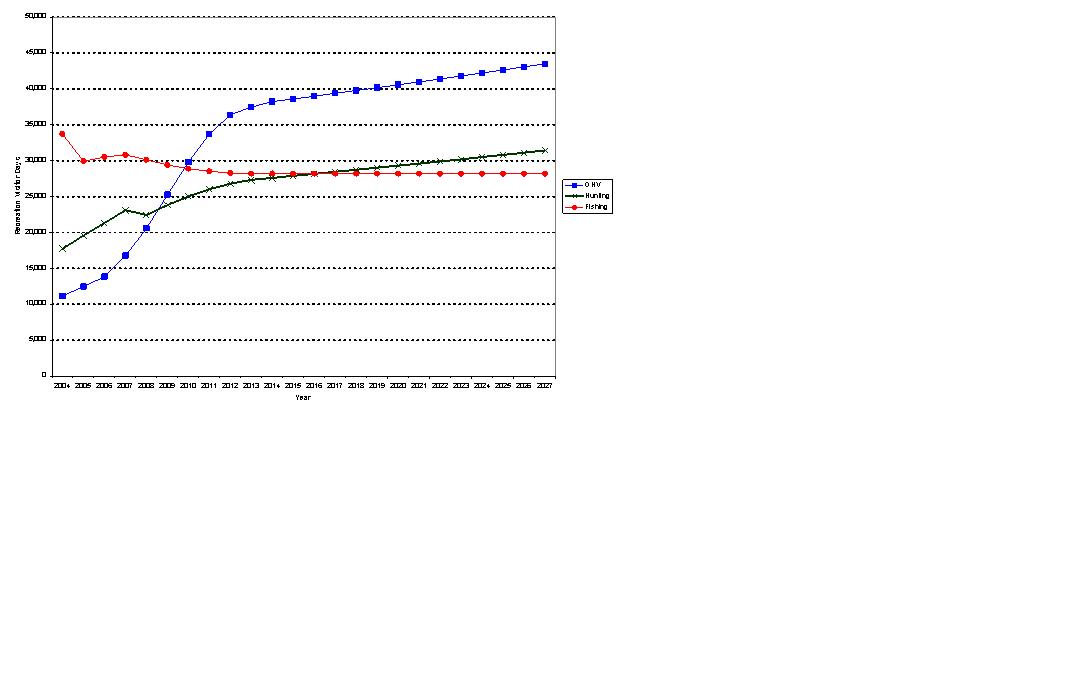
Economic impacts from recreation are a function of recreation visitor days (RVDs) and expenditures per day. Future RVDs were estimated based on current RVDs, recent growth rates, and projected trends. Estimates of future RVDs were based on the professional judgment of BLM staff, as well as a United States Forest Service (USFS) study that provides forecasts of recreation activity for the Rocky Mountain region (Bowker et al. 1999) and contacts with neighboring BLM field offices. Table X-11 provides a summary of estimated annual growth rates, and Figure X-1 provides a graphical view.
Table X.11. Estimated Growth Rates for Nonresident Recreation Visitor Days
| Year | OHV | Hunting | Fishing | |||
|---|---|---|---|---|---|---|
| RVDs this year | Growth over previous year | RVDs this year | Growth over previous year | RVDs this year | Growth over previous year | |
| 2004 | 11,177 | — | 17,707 | — | 33,725 | — |
| 2005 | 12,440 | 11.3% | 19,579 | 10.57% | 29,904 | -11.33% |
| 2006 | 13,846 | 11.3% | 21,288 | 8.73% | 30,523 | 2.07% |
| 2007 | 16,753 | 21.0% | 23,119 | 8.60% | 30,822 | 0.98% |
| 2008 | 20,573 | 22.8% | 22,432 | -2.97% | 30,113 | -2.30% |
| 2009 | 25,264 | 22.8% | 23,830 | 6.23% | 29,420 | -2.30% |
| 2010 | 29,811 | 18.0% | 25,021 | 5.0% | 28,891 | -1.8% |
| 2011 | 33,687 | 13.0% | 26,022 | 4.0% | 28,515 | -1.3% |
| 2012 | 36,381 | 8.0% | 26,802 | 3.0% | 28,287 | -0.8% |
| 2013 | 37,473 | 3.0% | 27,339 | 2.0% | 28,202 | -0.3% |
| 2014 | 38,222 | 2.0% | 27,612 | 1.0% | 28,202 | 0.0% |
| 2015 | 38,605 | 1.0% | 27,888 | 1.0% | 28,202 | 0.0% |
| 2016 | 38,991 | 1.0% | 28,167 | 1.0% | 28,202 | 0.0% |
| 2017 | 39,381 | 1.0% | 28,449 | 1.0% | 28,202 | 0.0% |
| 2018 | 39,774 | 1.0% | 28,733 | 1.0% | 28,202 | 0.0% |
| 2019 | 40,172 | 1.0% | 29,020 | 1.0% | 28,202 | 0.0% |
| 2020 | 40,574 | 1.0% | 29,311 | 1.0% | 28,202 | 0.0% |
| 2021 | 40,980 | 1.0% | 29,604 | 1.0% | 28,202 | 0.0% |
| 2022 | 41,389 | 1.0% | 29,900 | 1.0% | 28,202 | 0.0% |
| 2023 | 41,803 | 1.0% | 30,199 | 1.0% | 28,202 | 0.0% |
| 2024 | 42,221 | 1.0% | 30,501 | 1.0% | 28,202 | 0.0% |
| 2025 | 42,643 | 1.0% | 30,806 | 1.0% | 28,202 | 0.0% |
| 2026 | 43,070 | 1.0% | 31,114 | 1.0% | 28,202 | 0.0% |
| 2027 | 43,501 | 1.0% | 31,425 | 1.0% | 28,202 | 0.0% |
| Source: BLM 2009d. Data from 2009 through 2027 are projections. OHV Off-highway vehicle RVD Recreation visitor day | ||||||
 |
Source: BLM 2009d
OHVOff-highway Vehicle
Figure X.1. Recent Trends and Projected Future Change: Nonresident Recreation Visitor Days
The estimates for average expenditure per visitor day, in 2008 dollars, are $88.59 for fishing (Wyoming Game and Fish Department [WGFD] 2008; USFWS 2008); $134.70 for hunting (Responsive Management 2004); and $53.92 for off-highway vehicle (OHV) use (Foulke et al. 2006). Table X-12 shows the direct, indirect, and induced output per RVD for each recreation activity, in 2008 dollars.
Table X.12. Assumptions for Analysis of Impacts on Output for Recreation Activities
| Economic Impact | OHV (per RVD) | Hunting (per RVD) | Fishing (per RVD) |
|---|---|---|---|
| Direct Economic Impact1 | $53.92 | $134.70 | $88.59 |
| Indirect Economic Impact2 | $7.95 | $36.64 | $11.75 |
| Induced Economic Impact3 | $5.68 | $21.87 | $10.28 |
| Total Economic Impact | $67.55 | $193.20 | $110.62 |
| Multiplier (total impact/direct impact) | 1.25 | 1.43 | 1.25 |
| Note: Detail may not add to total due to rounding. 1Direct economic impact is the average expenditure per visitor day. 2Indirect impacts from Impact Analysis for Planning (IMPLAN) reflect increased demand in sectors that directly or indirectly provide support for the recreation industry. 3Induced impacts from IMPLAN reflect increased demand in the consumer and government sectors. OHV Off-highway vehicle RVD Recreation visitor day | |||
Table X-13 provides a summary of employment impacts assumed according to unit changes in RVDs.
Table X.13. Assumptions for Employment Impact Analysis for Recreation Activities
| Employment Impact (annual number of jobs) | OHV (per 1,000 RVDs) | Hunting (per 1,000 RVDS) | Fishing (per 1,000 RVDS) |
|---|---|---|---|
| Direct Employment | 0.69 | 2.45 | 1.24 |
| Indirect Employment | 0.07 | 0.33 | 0.10 |
| Induced Employment | 0.06 | 0.23 | 0.11 |
| Total Employment | 0.83 | 3.01 | 1.46 |
| Multiplier (Total Impact/Direct Impact) | 1.20 | 1.23 | 1.17 |
| Average Earnings per Job (2008 dollars) | $17,842 | $18,895 | $18,428 |
| Note: Direct, indirect, and induced employment impact and average earnings per job are calculated using Impact Analysis for Planning (IMPLAN). OHV Off-highway vehicle RVD Recreation visitor day | |||